How to Calculate Position Size in Forex (ICT Risk Management)
The position size formula with worked examples for EURUSD, a JPY pair, gold and indices, plus lot rounding, margin vs risk and common mistakes.
To calculate position size in forex, divide the money you are willing to lose on the trade by the stop distance multiplied by the value of one pip (or point) per lot: lot size = risk amount ÷ (stop distance × value per pip). The stop comes from the chart, the risk amount comes from your rules, and the lot size is simply the output. This guide from the LSG Club trading journal walks through the formula with worked examples for EURUSD, a JPY pair, gold and an index, then covers rounding, margin and the mistakes that quietly inflate risk.
The position size formula, step by step
Every correct position size calculation answers one question: if the stop is hit, how much do I lose? It works for any instrument once you know three numbers.
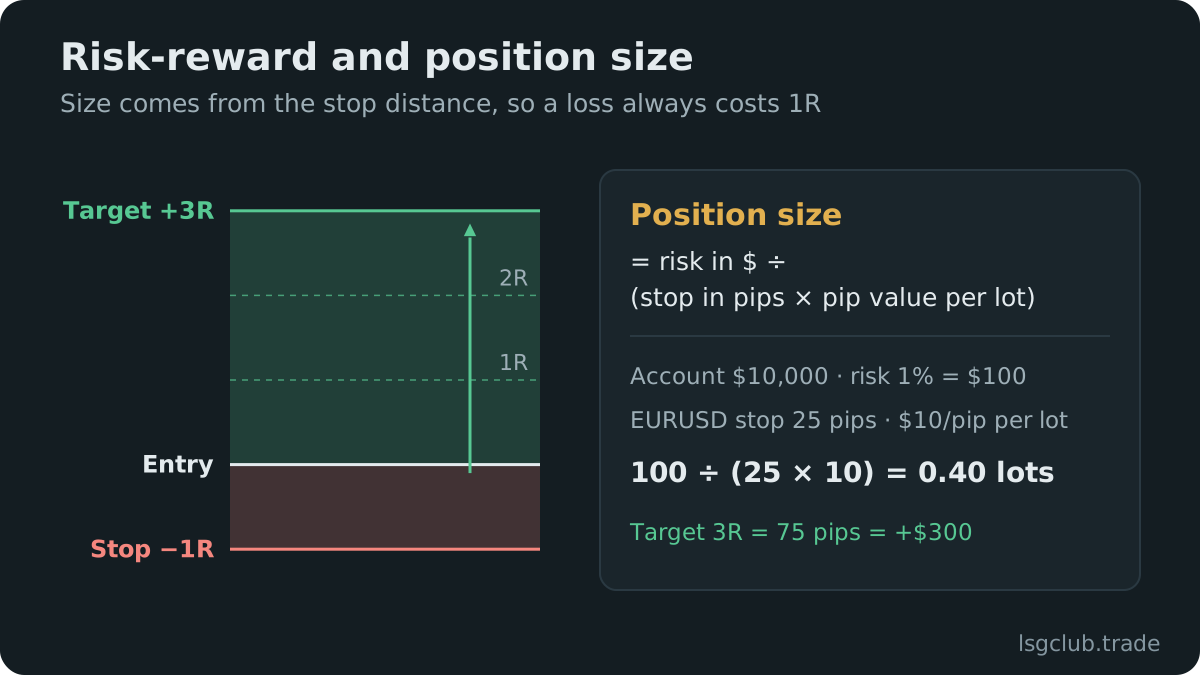
- Risk amount — account balance × risk per trade. A $10,000 account risking 1% has a risk amount of $100.
- Stop distance — the distance from entry to stop loss, measured in pips for currency pairs and in points or dollars for metals and indices.
- Value per pip (or point) per lot — what one pip of movement is worth on one standard lot, in your account currency. It depends on the contract size and the quote currency.
- Lot size — risk amount ÷ (stop distance × value per pip per lot), rounded down to your broker’s lot step.
The order matters. In ICT trading the stop sits where the idea is proven wrong — beyond the swing that swept liquidity, or beyond the candle that created the fair value gap you enter from. You place the stop first and let the size adjust. Moving the stop closer to “afford” a bigger position changes the trade idea, not just the arithmetic.
Worked position size examples by instrument
All four cases below are examples with round numbers for a $10,000 USD account risking 1% ($100). Prices are illustrative, not current quotes, and contract specifications differ between brokers, so confirm the numbers in your platform before you size a live trade.
Example 1: EURUSD (USD-quoted pair)
A standard lot is 100,000 units of the base currency and a pip is 0.0001. For pairs quoted in USD (EURUSD, GBPUSD, AUDUSD) one pip on one standard lot is worth $10. Suppose you short after a raid on buy-side liquidity, entering at 1.08500 with the stop at 1.08800 above the swept high: a 30-pip stop. Lot size = $100 ÷ (30 × $10) = 0.333, which rounds down to 0.33 lots. If the stop is hit, the loss is 0.33 × 30 × $10 = $99 before spread and commission.
Example 2: USDJPY (JPY-quoted pair)
On JPY pairs a pip is 0.01, so one pip on a standard lot is worth 1,000 yen. To convert it into dollars, divide by the USDJPY rate. At an example rate of 150.00, a pip is worth 1,000 ÷ 150 ≈ $6.67 per standard lot. With a 25-pip stop: $100 ÷ (25 × $6.67) = 0.60 lots. Recalculate it for every trade, because the pip value moves with the exchange rate. The same logic applies to crosses like GBPJPY: the pip is still worth 1,000 yen per lot, converted at the current USDJPY rate.
Example 3: XAUUSD (gold)
Gold is where most sizing errors happen, because brokers define the contract and the “pip” differently. On many platforms one lot of XAUUSD is 100 troy ounces, so a $1.00 move in price equals $100 per lot — but check your broker’s contract spec, since some use different contract sizes. Measure the stop in dollars of price rather than pips. Example: a long with the stop $8.00 below entry gives $100 ÷ (8 × $100) = 0.125, rounded down to 0.12 lots. With gold trading in the thousands of dollars per ounce, a stop that looks small in percent can still be many dollars wide, so think about stop size relative to the current ATR. Our guide to trading XAUUSD with ICT concepts covers where those stops usually belong.
Example 4: indices (NAS100, US30, futures)
Index CFDs are quoted in points, and the value of one point per lot varies a lot between brokers: on one platform 1.0 lot of NAS100 may be $1 per point, on another $10 or more. Example: a CFD at $1 per point per lot with a 40-point stop gives $100 ÷ (40 × $1) = 2.5 lots. Futures are standardized: the CME micro Nasdaq contract (MNQ) is $2 per point, so a 40-point stop costs $80 per contract and one contract fits a $100 budget. The full-size NQ at $20 per point would risk $800 on the same stop.
How much to risk per trade
The formula does not tell you the percentage; your rules do. Many discretionary traders work in a range of roughly 0.25–1% per trade, and lower while a strategy is new or during a drawdown. The reason is arithmetic, not caution for its own sake: losing streaks are normal for any edge, and the percentage determines how deep a streak goes.
- Ten losses in a row at 1% — about a 9.6% drawdown, recoverable with a working edge.
- Ten losses in a row at 2% — about an 18.3% drawdown, which already breaks many prop-firm rules.
- Ten losses in a row at 5% — about a 40% drawdown, which needs a gain of roughly 67% just to get back to the start.
Prop accounts add a second constraint. For example, a typical two-step challenge has a daily loss limit around 5% and a maximum loss around 10% — check your firm’s current rules, because they change. Size each trade so that your planned number of losers per day stays well inside the daily limit, including open-trade swings. Our prop firm trading journal guide explains how to plan a challenge around those limits.
Lot rounding, spread and account currency
The raw formula rarely produces a clean number, and a few small details decide whether your real loss matches the plan.
- Round down, never up — if the formula gives 0.337 lots, trade 0.33. Rounding up turns 1% into slightly more than 1% every time.
- Respect the lot step and minimum — most forex brokers use a 0.01 lot step, but some metals and indices use 0.1 or a higher minimum. If the minimum lot already exceeds your risk amount, skip the trade.
- Include spread and commission — a 30-pip stop with a 1-pip spread and $7 round-turn commission per lot costs more than 30 pips. On tight stops, costs are a meaningful share of the risk.
- Convert to your account currency — the $10 pip value assumes a USD account. A EUR or GBP account must convert the pip value at the current rate.
Margin vs risk: why leverage does not set your position size
Margin is the deposit the broker locks to open a position; risk is what you lose if the stop is hit. They are different numbers. In Example 1, 0.33 lots of EURUSD is 33,000 euros of exposure, roughly $35,800 at a price of 1.085. At 1:30 leverage the margin is about $1,190; at 1:500 it is about $72. The risk is $99 in both cases, because the stop decides the loss.
Higher leverage only lets you open a larger position than your risk rules allow. If you size from free margin instead of from the stop, a normal losing trade can take 10–20% of the account. Treat leverage as a ceiling you should never touch, not as a sizing input.
Common position sizing mistakes
- Fixed lot size on every trade — 0.5 lots with a 10-pip stop and 0.5 lots with a 50-pip stop are completely different risks.
- Reusing EURUSD pip values on other instruments — JPY pairs, gold and indices all need their own value per pip or point.
- Shrinking the stop to fit a bigger size — the stop moves out of the invalidation zone and gets taken by ordinary noise or a second sweep.
- Sizing up after a loss — the classic revenge trade; it turns one planned 1R loss into a 3R hole.
- Ignoring correlated positions — long EURUSD and long GBPUSD at 1% each is closer to 2% on one dollar idea.
- Not checking actual vs planned risk — slippage, wider news spreads and manual rounding drift the real number away from the plan.
The last point is where a journal earns its keep. When every trade is logged with its stop and result in R, a loss of 1.4R instead of 1R stands out immediately. Our ICT trading journal template lists the fields worth recording, and the article on the risk-reward ratio in ICT trading shows how position size and target placement work together.
Tracking planned vs actual risk in your journal
Position size is only correct if the loss you actually take matches the loss you planned. In the LSG Club journal every trade sits on a real chart with its stop and target zones, and results can be viewed in dollars, percent or R. MT4 and MT5 reports import from HTML or CSV, so the real fills and costs are what you review. For prop accounts, the challenge tracker shows the profit target, daily and maximum loss and trading days next to the trades that used them. You can explore it with sample data in the journal demo. To skip the arithmetic, the free position size calculator does it for forex, JPY pairs, gold, indices and crypto in your account currency.
FAQ
How many lots should I trade with a $1,000 account?
It depends on the stop, not the balance alone. At 1% risk you have $10 to lose; on EURUSD with a 20-pip stop that is $10 ÷ (20 × $10) = 0.05 lots. With a 50-pip stop it is 0.02 lots. Small accounts need micro lots (0.01) to size correctly at all.
How do I calculate position size for gold?
Measure the stop in dollars of price and multiply by the contract size. If one lot is 100 oz, each $1 of price movement is $100 per lot, so lot size = risk amount ÷ (stop in dollars × 100). Always confirm the contract size in your broker’s specification first.
Does leverage change my position size?
No. Leverage changes how much margin a position needs, not how much you lose at the stop. The correct size comes from the risk amount and the stop distance; leverage only determines whether the broker lets you open it.