ICT Liquidity Sweep: What It Is and How to Trade It
What an ICT liquidity sweep is, how to tell a sweep from a breakout, and how to enter after confirmation with the stop beyond the swept extreme.
An ICT liquidity sweep is a short, fast run beyond an obvious high or low that takes out the stop orders resting there and then fails to continue. Traders at LSG Club use it as the trigger that turns a marked level into a trade idea: the sweep shows where orders were filled, and the reaction after it shows which side of the market is in control. This guide covers how to spot a sweep, how to tell it apart from a real breakout, and how to enter with the stop beyond the swept extreme.
What an ICT liquidity sweep is
In ICT terms, liquidity is the cluster of orders sitting at predictable prices. Stop-losses, breakout entries and pending orders gather just beyond swing points because that is where most traders place them. A sweep (ICT also says "raid" or "run on liquidity") is price trading through that cluster, filling those orders, and then moving away from the level.
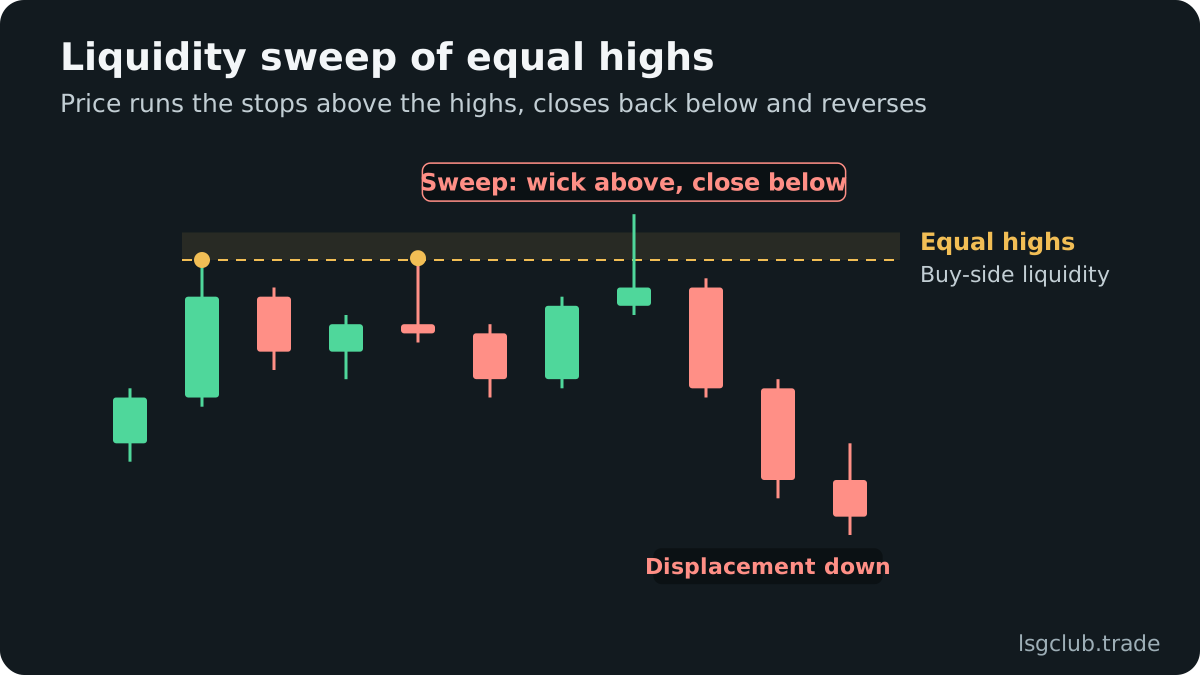
The point is not that someone is hunting your personal stop. The point is that large orders need large opposite orders to fill against, and the densest pools of opposite orders sit beyond obvious highs and lows. When a big buyer wants size, the sell stops below a clear low are the easiest place to find it.
Buy-side liquidity
Buy-side liquidity rests above highs: the buy stops of traders who are short, plus the buy-stop entries of breakout traders. When price runs above a high and then reverses lower, ICT calls that a buy-side sweep. It often marks the high of a move in a bearish context, because sellers were able to fill against all those buy orders.
Sell-side liquidity
Sell-side liquidity rests below lows: the sell stops of traders who are long, plus breakout sell orders. A run below a low that snaps back is a sell-side sweep, and in a bullish context it frequently forms the low of the move. Keep the direction straight in your notes: buy-side is above, sell-side is below.
Where liquidity rests on the chart
Not every high or low is worth watching. The levels that attract a sweep are the ones many traders can see at the same time. Mark these before the session starts:
- Previous day high and low — the most widely watched intraday reference points
- Previous week high and low — larger pools that often frame the whole week
- Equal highs and equal lows — two or more touches at nearly the same price, a textbook pool
- Session highs and lows — the Asian range high and low before London, the London range before New York
- Clean swing points — obvious turning points on H1 and H4 with no wick through them yet
- Trendline touches — a neat line of higher lows or lower highs, with stops stacked just beyond each touch
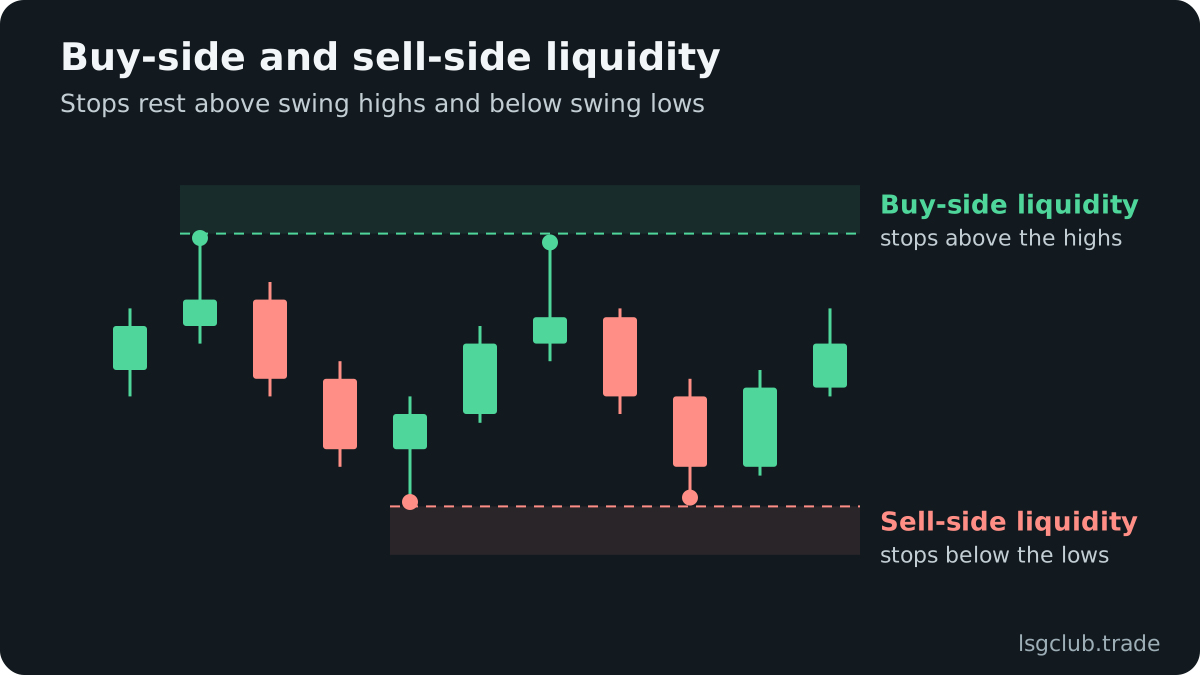
Smaller, internal pools inside a range often act as bait before the larger move. That idea has its own name, and the article on inducement and liquidity pools covers how those traps form.
Liquidity sweep vs breakout
Both start the same way: price trades through a level. The difference shows up in what happens after the level breaks. Judge it on closes and follow-through, not on the moment price pokes through.
Signs of a sweep
- Price trades beyond the level and closes back inside it on the timeframe you are reading
- The excursion is quick — one to three candles — with a long wick left behind
- There is no acceptance beyond the level: no candle bodies building above a swept high or below a swept low
- A displacement move follows in the opposite direction, often leaving a fair value gap
- The sweep happens into a higher-timeframe premium or discount zone that suits the opposite trade
Signs of a genuine breakout
- Candles close beyond the level and the next candles hold there
- The old level is retested from the other side and respected
- The move is in the direction of the higher-timeframe draw on liquidity
- No market structure shift appears against the breakout
Context decides most cases. A run above the previous day high during a bearish daily bias, into a premium array, is a sweep candidate. The same run during a bullish bias with the weekly high still above is more likely a breakout toward that higher target. The daily bias routine is what tells you which reading to expect.
Confirming the sweep before you enter
A wick through a level is only a candidate. ICT traders want the market to prove the reversal with a shift in structure. After a sell-side sweep, that means price rallies with displacement and breaks above the most recent short-term high that led into the sweep. This is the market structure shift (MSS), and without it there is no confirmed setup.
The displacement leg usually leaves an imbalance behind. A fair value gap or an order block inside that leg becomes the entry zone on the retracement. If price breaks structure in a slow, overlapping grind with no gap, treat the confirmation as weak.
How to trade a liquidity sweep step by step
- Set the bias on H4 or D1 and identify the draw on liquidity — the pool price is most likely heading toward.
- Mark the opposing pool that price may raid first: below lows for a bullish idea, above highs for a bearish one.
- Wait for the raid, ideally inside a Kill Zone, and for a close back inside the level on M5 or M15.
- Wait for a market structure shift with displacement away from the swept extreme.
- Place a limit order in the fair value gap or order block left by the displacement leg.
- Put the stop beyond the swept extreme, then size the position from that stop distance.
- Target the next pool in the direction of the bias, with a partial at the first internal high or low.
Stop placement beyond the swept extreme
The swept high or low is the invalidation. If the idea is right, price should not return beyond the extreme that just filled the orders. Place the stop a few points past it, with a buffer sized for spread and the instrument’s normal noise; on volatile markets such as gold, a fraction of the M15 ATR is a better buffer than a fixed number of points.
Targets and trade management
Aim at liquidity on the other side: the opposite session extreme, the previous day high or low, or equal highs and lows left untouched. If the nearest pool is closer than twice your risk, the trade is usually not worth taking. Many traders move the stop to break-even only after price clears the first internal swing, not on the first small push in their favor.
Example: a sell-side sweep in the London session
This is a hypothetical example for illustration. EURUSD has a bullish daily bias, with last week’s high as the draw. During the Asian session price builds a tight range, leaving clean lows. In the London Kill Zone (02:00–05:00 New York time), price drops through the Asian low and the previous day low, prints a long lower wick, and the M5 candle closes back above the Asian low.
Fifteen minutes later a strong bullish candle breaks the last M5 lower high and leaves a fair value gap. The trader sets a buy limit at the top of the gap, the stop a few pips below the sweep low, and the first target at the Asian high. The final target is the previous day high. If price had instead closed two M15 candles below the swept low, the idea would have been dropped without an entry.
Common liquidity sweep mistakes
- Entering on the wick itself — buying the first spike below a low before any close back inside or structure shift
- Calling every break a sweep — ignoring the higher-timeframe draw and fading real breakouts
- Stops inside the sweep wick — placing the stop where the next push will take it out
- Marking too many levels — a chart covered in lines makes every move look like a sweep
- Trading outside active hours — sweeps in thin, quiet periods often lack the follow-through that Kill Zone moves have
A sweep that closes back inside and then reverses straight away, without a structure shift, is close to the Turtle Soup pattern. That pattern is a valid trade, but it carries more risk because the confirmation is thinner.
Journaling and reviewing sweep trades
Record, for every sweep trade, which pool was taken, which session it happened in, how price confirmed the reversal and where the stop sat relative to the extreme. After twenty or thirty trades the pattern in your own results becomes visible: maybe previous day lows work for you and Asian lows do not, or entries before the MSS keep losing. You can see how trades sit on a real chart with stop and target zones in the journal demo.
FAQ
Is a liquidity sweep the same as a stop hunt?
They describe the same price action from different angles. "Stop hunt" focuses on the stops being hit; "liquidity sweep" focuses on why it happens, which is that resting orders provide the fill for larger positions. ICT prefers the liquidity framing because it tells you where the next target is.
Which timeframe is best for spotting a liquidity sweep?
Mark the pools on H1, H4 and D1, then watch the reaction on M5 or M15. The higher timeframe tells you which levels matter; the lower timeframe shows the close back inside and the structure shift. A sweep visible only on M1 with no higher-timeframe level behind it is rarely worth trading.
How do I know when a sweep has failed?
The sweep fails when price returns beyond the swept extreme and starts closing there. That is also where your stop belongs, so the market tells you at a defined cost. A second clean close beyond the level usually means the move was a breakout, not a raid.
Can liquidity sweeps happen on gold and indices?
Yes. The concept applies to any market where traders place stops around visible highs and lows, including XAUUSD and the major indices. The ranges on those instruments are wider, so size the stop buffer from ATR rather than copying forex pip values.