ICT Inverse FVG (IFVG): How a Failed Fair Value Gap Flips
ICT inverse FVG explained: how a fair value gap that price closes through flips its role, how to mark an IFVG, entries, stops and mistakes.
An inverse FVG (IFVG, or inversion fair value gap) is a fair value gap that price closes through with displacement, so the zone flips its role: a failed bullish gap becomes resistance, and a failed bearish gap becomes support. Traders then wait for price to come back to the inverted gap and enter on that retest in the direction of the move that broke it. This guide from LSG Club, the free journal for IFVG trades, explains how to mark an inverse FVG step by step, how it differs from a normal FVG and a breaker block, where the entry, stop and target go, and which mistakes cost the most.
The concept comes from the teaching of ICT (Michael J. Huddleston) and is now a standard part of Smart Money Concepts vocabulary. The short version: a normal fair value gap is traded in the direction of the move that created it, while an IFVG is traded in the opposite direction, because the market has shown that the original imbalance no longer holds.
What is an inverse FVG?
Start with the ordinary gap. A fair value gap is a three-candle pattern in which the wicks of candle 1 and candle 3 do not overlap, leaving a range that was traded in only one direction. A bullish FVG sits below price and is expected to act as support on a retracement; a bearish FVG sits above price and is expected to act as resistance. The full explanation, including consequent encroachment (the 50% line), is in the fair value gap trading strategy guide, so this article only builds on it.
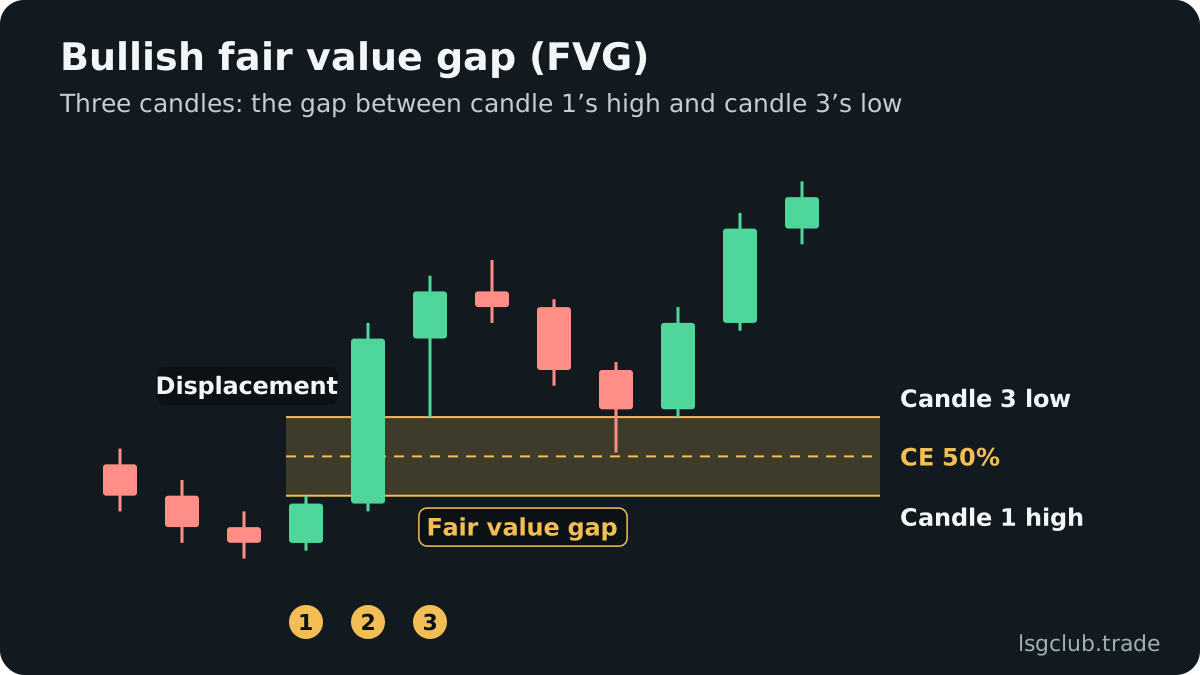
An FVG becomes an inverse FVG when it fails in a specific way. Price does not just wick into the gap or fill it slowly; a candle body closes beyond the far side of the zone, and the candle doing it is a displacement candle, larger and more decisive than the bars around it. From that moment the zone is read from the other side.
Bullish IFVG
A bullish inverse FVG starts life as a bearish FVG (a SIBI) above price. Instead of holding as resistance, the gap is closed through upward: a strong bullish candle closes above the top of the zone. The old resistance is now expected to act as support. The trade idea is a long when price pulls back down into the inverted gap.
Bearish IFVG
A bearish inverse FVG starts as a bullish FVG (a BISI) below price. A strong bearish candle closes below the bottom of the zone, and the old support is now expected to act as resistance. The trade idea is a short when price rallies back up into the inverted gap. If the SIBI and BISI labels are new to you, the SIBI and BISI explainer covers them in detail.
How to identify an inverse FVG step by step
Work through these steps in order; if one fails, you do not have a tradable inversion.
- Mark a valid FVG first. Note the exact edges: for a bullish gap, candle 1 high (bottom) and candle 3 low (top); for a bearish gap, candle 3 high (bottom) and candle 1 low (top). Mark the 50% line as well.
- Confirm the gap had a job. It should sit at a meaningful place: inside the last leg of the trend, near a swing, or as the gap that price was expected to defend.
- Wait for a body close beyond the far edge. For a bullish gap, the close must be below the bottom of the zone; for a bearish gap, above the top. A wick through the zone that closes back inside is not an inversion.
- Check that the break is displacement. The candle that closes through the gap should be large relative to recent candles, ideally leaving its own new FVG in the new direction.
- Look for context in the new direction. The strongest inversions appear after a sweep of liquidity on the other side and together with a market structure shift. The break of the gap and the break of structure are often the same candle.
- Re-label the zone. The same two edges now define the IFVG. Its 50% line still matters.
- Define invalidation before price returns. A body close back through the opposite edge of the inverted zone (above the top of a bearish IFVG, below the bottom of a bullish one) means the inversion itself has failed.
Step 3 is where most chart readers go wrong. The whole concept rests on the close: the market accepted prices beyond the gap. A wick only shows that price probed there, and probes beyond a level are often liquidity sweeps that end in the original direction.
Why inverse fair value gaps work
Treat an IFVG as a probability zone, not a wall. The common ICT reading is about positioning. When a bullish gap forms, traders who missed the move place buy orders inside it, expecting a retracement to hold. When price slices through the gap with displacement, those buyers are suddenly in a losing position. On the next rally back into the zone, many of them sell to get out near break-even, and fresh sellers who read the failure join them. That supply is what tends to cap the retest.
Inverse FVG vs normal FVG vs breaker block
The three concepts are often confused because all of them describe a zone that price returns to. The differences are in what created the zone and in which direction you trade it.
Inverse FVG vs a normal FVG
- Direction — a normal FVG is traded in the direction of the move that created it; an IFVG is traded against that original direction, in the direction of the move that broke the gap.
- Status of the gap — a normal FVG is still respected; price may enter it, even close beyond the 50% line, but has not closed beyond the far edge. An IFVG is a gap that price has already closed through.
- Expectation on the retest — the normal gap is expected to hold from the same side; the inverted gap is expected to hold from the opposite side.
Inverse FVG vs a breaker block
A breaker block is a failed order block, not a failed gap. It is built from a candle (the last opposite-coloured candle before a move), and ICT’s definition requires a sequence: a sweep of a prior high or low, then a displacement break of structure through the order block. An inverse FVG is built from a three-candle imbalance and is defined by the close through that imbalance. A sweep makes an IFVG stronger, but it is not part of the definition.
In practice the two often appear together. The same displacement that breaks through a bullish order block frequently breaks through the bullish FVG next to it, so the breaker and the IFVG overlap. When they do, many traders treat the overlapping range as one stronger zone and place the entry where both agree.
Where CISD and MSS fit
An IFVG is a zone; a market structure shift and a change in the state of delivery (CISD) are events. The event tells you that order flow may have changed; the inverted gap gives you a concrete price range to use on the retest. A clean sequence reads like this: sweep, displacement that shifts structure and closes through the last gap, then a pullback into that inverted gap.
How to trade an inverse FVG: entry, stop and target
An IFVG is a retracement entry. The failure of the gap has already happened; you are waiting for price to return. If it never returns, there is no trade, and chasing the displacement candle is a different setup with a worse price.
Entry on the retest
There are three common entry points, and each trades fill rate for price:
- Near edge — the first edge price touches on the retest (the bottom of a bearish IFVG, the top of a bullish one). Highest fill rate, worst price, widest stop.
- 50% line — the midpoint of the inverted gap. A balanced choice: better price and tighter stop, but some retests turn before reaching it.
- Confirmation entry — wait for price to enter the zone, then drop to a lower timeframe and enter after a small shift in the trade direction. Fewer trades, often tighter risk, but you will miss fast reactions.
Whichever you choose, keep it fixed for a meaningful sample, or you will never know which one works for you.
Stop placement
The tight stop goes a few pips beyond the far edge of the inverted gap: above the top of a bearish IFVG, below the bottom of a bullish one. A body close there invalidates the inversion, so the stop sits where the idea is wrong. The conservative stop goes beyond the swing extreme that started the displacement, often the high or low that swept liquidity. It survives deeper retests but halves or worse the risk-reward. Size the position from the stop distance with a position size calculator, never the other way around.
Targets
Targets come from liquidity in the new direction: the nearest swing low for a short, the nearest swing high for a long, then a larger pool such as the session or previous day’s extreme. An opposing FVG in the path is a natural place to take partial profit, because price often stalls when it meets the next imbalance. If the first target does not offer at least about twice the risk from your planned entry, the setup is usually not worth taking.
Worked example: a bearish IFVG on EURUSD (illustration)
This is a teaching example with rounded prices, not a trade record. EURUSD is on the M15 chart before the London session. Earlier in the night a bullish displacement left a bullish FVG: candle 1 high at 1.0842 and candle 3 low at 1.0856. The gap is 14 pips wide, from 1.0842 to 1.0856, with its 50% line at 1.0849.
- The sweep. In the London Kill Zone (02:00–05:00 New York time) price rallies above the Asian session high at 1.0875, prints 1.0878 and stalls. Buy-side liquidity above the Asian high has been taken.
- The failure. A large bearish M15 candle drops from the high and closes at 1.0835, seven pips below the bottom of the bullish gap at 1.0842. The body closed through the whole zone, and the candle is two to three times the size of the bars before it. The bullish FVG is now a bearish IFVG from 1.0842 to 1.0856.
- The plan. The trader places a sell limit at 1.0848, just under the 50% line, with a stop at 1.0860, four pips above the top of the zone. Risk is 1.0860 − 1.0848 = 12 pips. The target is the Asian session low at 1.0812: 1.0848 − 1.0812 = 36 pips, so the reward is 36 ÷ 12 = 3R.
- Position size. On a $10,000 account risking 1% ($100) with EURUSD at about $10 per pip per standard lot, the size is 100 ÷ (12 × 10) ≈ 0.83 lots. At the stop the loss would be 0.83 × 12 × 10 ≈ $99.6.
- The retest. Price pulls back, enters the inverted gap at 1.0842, reaches 1.0850 and fills the order. A bearish candle then closes back below 1.0842 and price works lower toward the target.
- Invalidation. Had any M15 body closed above 1.0856 before or after the fill, the inversion would have failed and the order would be cancelled or the trade closed at the stop.
Compare the conservative version. A stop above the sweep high at 1.0880 makes the risk 1.0880 − 1.0848 = 32 pips, and the same 36-pip target is only 36 ÷ 32 ≈ 1.1R. Size would drop to about 100 ÷ (32 × 10) ≈ 0.31 lots. The tight stop gets hit more often; the wide one pays less when it works. Your own trade history should decide.
Variations of the inverse FVG
- Higher timeframe IFVG — an inverted gap on H4 or daily works as a PD array, a zone where you look for a lower timeframe entry rather than a level to blindly trade. The PD arrays guide shows how such zones are ranked.
- IFVG with a breaker — when the inverted gap overlaps a breaker block from the same move, the overlap is often treated as the highest-quality part of the zone.
- Partial inversion — price closes beyond the 50% line but not the far edge. This is a weakening gap, not an IFVG. Treat it as a reason to be careful with the original setup, not as a signal in the new direction.
Common inverse FVG mistakes
- Counting wicks — a wick through the gap that closes back inside is not an inversion. Without a body close there is nothing to trade from the other side.
- Ignoring displacement — a slow drift through the gap over many candles traps no one. Inversions after weak, overlapping candles fail more often.
- Inverting every gap — not every filled FVG matters. Trade inversions of gaps that had a job: the last defended gap of a leg, near a swing, or at a higher timeframe level.
- Trading against the higher timeframe without a reason — a bearish IFVG on M5 inside a strong daily uptrend is a counter-trend scalp at best. Know your bias before you trade the zone.
- Moving the stop inside the zone — if your stop sits inside the inverted gap, ordinary retest noise will take it out before the idea is proven wrong.
- Chasing the displacement candle — selling the close of the breakdown candle gives you the worst price and the widest stop. The edge of the setup is the retest.
Trading involves risk, and an IFVG reduces none of it by itself: it only gives you a defined place to be wrong. Practise the setup on a demo account first and record every trade, including the retests that never filled.
Inverse FVG checklist
- The original FVG was valid and sat in a meaningful place.
- A candle body closed beyond the far edge of the gap with displacement.
- The higher timeframe bias does not argue strongly against the trade.
- Entry type is fixed in advance: near edge, 50% line or lower timeframe confirmation.
- The stop is beyond the far edge of the inverted gap or beyond the swing extreme, never inside the zone.
- The first liquidity target offers at least about 2R from the planned entry.
- Invalidation is written down: a body close back through the opposite edge cancels the setup.
How to review your IFVG trades
Small choices change IFVG results a lot: edge or midpoint entry, tight or wide stop, with or without a prior sweep. Tag each trade with them, record the result in R and compare the groups after 30 or more trades. An ICT trading journal that shows each trade on a real chart makes this review much faster than a spreadsheet.
FAQ
What is an inverse FVG in ICT?
An inverse FVG, or IFVG, is a fair value gap that price has closed through with displacement. The zone flips its role: a failed bullish gap becomes resistance and a failed bearish gap becomes support. Traders look for an entry when price retests it.
What is the difference between an IFVG and an FVG?
A normal FVG is still respected and is traded in the direction of the move that created it. An IFVG is a gap that has already failed, and it is traded in the opposite direction, the direction of the candle that closed through it.
Is an inversion fair value gap the same as a breaker block?
No. A breaker block is a failed order block and, in ICT’s definition, requires a sweep of a prior high or low before the break. An inversion fair value gap is a failed three-candle imbalance. They often overlap after the same displacement, which is why traders confuse them.
Does a wick through the gap create an IFVG?
Under the usual convention, no. The inversion needs a candle body to close beyond the far edge of the gap. A wick that closes back inside is more often a liquidity sweep, and the original gap may still hold.