ICT SIBI and BISI: Sell-Side and Buy-Side Imbalances Explained
ICT SIBI and BISI explained: what sell-side and buy-side imbalances are, how they relate to FVGs and how traders use them for entries.
SIBI stands for sell-side imbalance, buy-side inefficiency: a three-candle price range on a down move where only sellers were delivered, so buyers never got a chance to trade there. BISI is the mirror image, a buy-side imbalance, sell-side inefficiency left by a fast up move. Both terms come from ICT (Michael J. Huddleston), and on the chart a SIBI is a bearish fair value gap while a BISI is a bullish one. This guide shows how to mark each one, why the 50% line matters, and how traders plan entries, stops and targets around them. If you want to measure whether these setups work for you, the LSG Club journal for logging SIBI and BISI trades keeps every trade on a real chart.
In short: when you hear “SIBI trading”, read “trading a bearish FVG on the retracement”, and when you hear “BISI”, read “trading a bullish FVG on the pullback”. The names do not describe a different pattern. They describe what happened inside the gap: which side of the market was filled and which side was skipped.
What SIBI and BISI mean in ICT
ICT describes price as being delivered to buyers and sellers. In a balanced market, a move up offers price to buyers and a move back down offers it to sellers, so every price level gets traded by both sides. When price moves so fast that one side is skipped, the range is left one-sided. That range is the imbalance, and ICT expects price to come back to it later to “rebalance” before continuing.
SIBI: sell-side imbalance, buy-side inefficiency
A SIBI forms on a sharp drop. Aggressive selling pushed price lower so quickly that the range was only offered to the sell side: sellers were filled, buyers had no opportunity to buy inside it. The “imbalance” is the excess of selling; the “inefficiency” is the buy side that was never offered. When price retraces up into a SIBI, the zone is expected to act as resistance, because it is where sellers were in control.
BISI: buy-side imbalance, sell-side inefficiency
A BISI forms on a sharp rally. Aggressive buying lifted price so fast that the range was only offered to the buy side, and sellers were skipped. When price pulls back down into a BISI, the zone is expected to act as support, because buyers were in control there.
- SIBI = bearish fair value gap = expected resistance on a retracement up.
- BISI = bullish fair value gap = expected support on a pullback down.
- The first word of each name (“sell-side” or “buy-side”) tells you which side was aggressive and which way the displacement went.
- Both are PD arrays: levels where price is expected to react, not certain turning points.
SIBI vs BISI and fair value gaps
Every SIBI and every BISI is a fair value gap. The FVG is the shape on the chart; SIBI and BISI are ICT’s names for the two directions of that shape. If you already know the fair value gap trading strategy, you already know how to draw them. The value of the SIBI/BISI vocabulary is that it forces you to name the direction and remember what the zone is supposed to do.
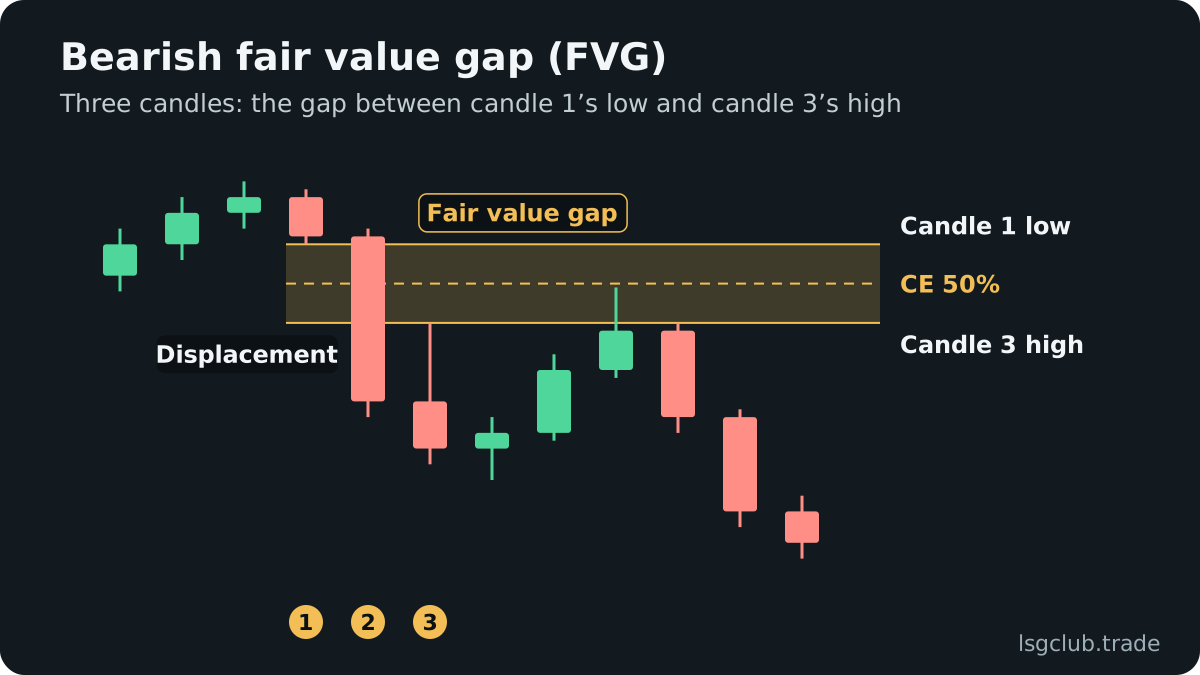
- SIBI (bearish FVG): the high of candle 3 is below the low of candle 1. The zone runs from candle 3’s high (bottom) to candle 1’s low (top).
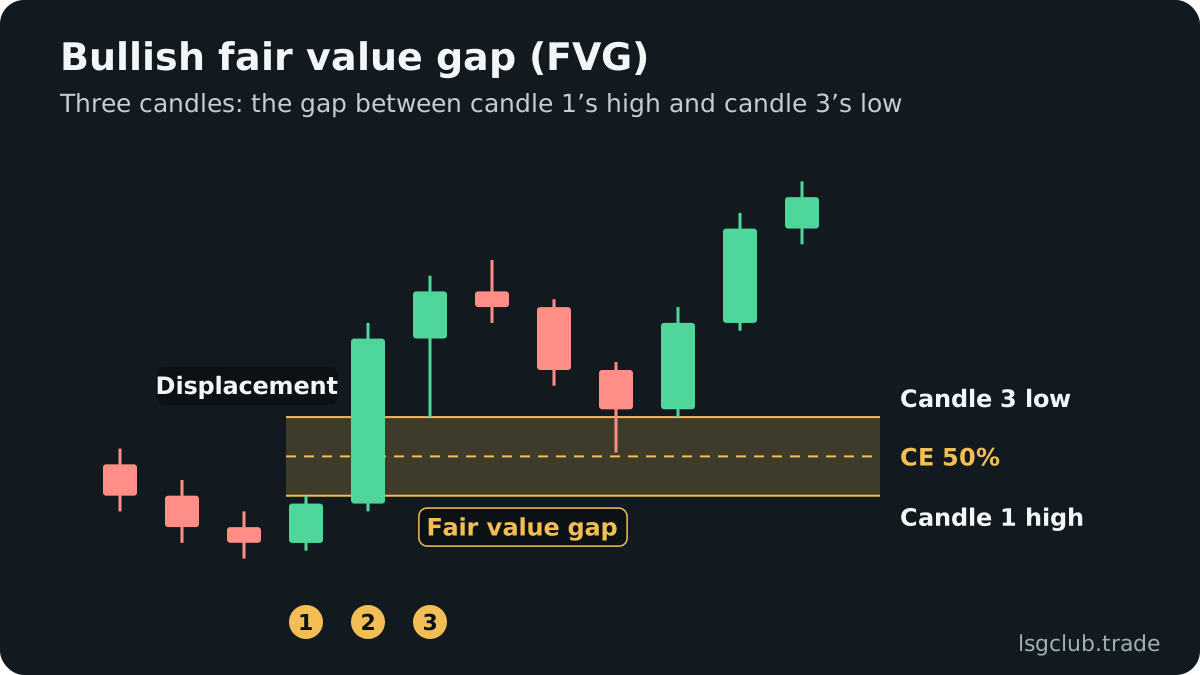
- BISI (bullish FVG): the low of candle 3 is above the high of candle 1. The zone runs from candle 1’s high (bottom) to candle 3’s low (top).
- The middle candle in both cases should be a displacement candle: a large body, clearly bigger than the candles around it.
- The gap is measured wick to wick, not body to body. Bodies are used later, to judge whether the zone is holding.
How to identify a SIBI step by step
Charts are full of small gaps. The point is not to find every SIBI, but to find the few that carry information. Work through these steps on the timeframe you trade, after you have a directional bias from a higher timeframe.
- Find a bearish displacement candle: a big red body that moves price decisively lower, ideally after price has swept a nearby high.
- Look at the candle before it (candle 1) and the candle after it (candle 3).
- Check that candle 3’s high is below candle 1’s low. If the wicks overlap, there is no SIBI.
- Draw a box from candle 1’s low (top) down to candle 3’s high (bottom).
- Mark the midpoint of the box. This is consequent encroachment (CE).
- Ask whether the move that created the gap also broke structure. A SIBI born from a break of a swing low means much more than one in the middle of a range.
- Note whether price has already traded back into the gap. An untouched SIBI is “fresh”; one that price has already closed through is used up or inverted.
Identifying a BISI
Flip every step. Find a bullish displacement candle, ideally after a sweep of a nearby low, check that candle 3’s low is above candle 1’s high, draw the box from candle 1’s high (bottom) up to candle 3’s low (top), and mark the midpoint. The strongest BISIs sit in the discount half of the dealing range, where buying makes sense; the premium and discount guide explains how to draw that range.
Consequent encroachment: the 50% of the gap
Consequent encroachment (CE) is the midpoint of a SIBI or BISI: (top + bottom) ÷ 2. ICT treats it as the most sensitive level inside the gap. A strong imbalance often gets “encroached” only to around the middle before price continues in the direction of the displacement.
CE does two jobs. It is an entry level: a limit order at the midpoint gives a better price than the near edge and keeps the stop tighter than waiting for a full fill. It is also a health check, read with candle bodies rather than wicks:
- SIBI holding: price wicks into the gap, but candle bodies close back below CE. Sellers are still defending it.
- SIBI weakening: bodies close above CE. The gap is losing its power as resistance.
- SIBI failed: bodies close above the top of the gap (candle 1’s low). The zone may now flip into support as an inverse FVG.
- For a BISI, read all three rules upside down: bodies should stay above CE, and a close below the bottom of the gap means it failed.
Worked example: trading a SIBI on EURUSD
This is a teaching illustration with round numbers, not a trade record. The daily chart of EURUSD is bearish, and an old daily low at 1.08340 sits below price as untouched sell-side liquidity. During the London session, price spikes above the Asian session high to 1.08720, sweeping the buy stops resting there.
Price then drops hard on the M15 chart. The three candles around the drop look like this:
- Candle 1: high 1.08720, low 1.08640.
- Candle 2 (displacement): opens near 1.08650 and closes at 1.08480, breaking the last M15 swing low at 1.08520.
- Candle 3: high 1.08560, low 1.08460.
Candle 3’s high (1.08560) is below candle 1’s low (1.08640), so there is a SIBI from 1.08560 to 1.08640. That is an 8-pip gap. Consequent encroachment is (1.08640 + 1.08560) ÷ 2 = 1.08600.
The trade plan
- Entry: sell limit at CE, 1.08600.
- Stop: 1.08730, one pip above the sweep high of 1.08720. Risk is 1.08730 − 1.08600 = 13 pips.
- Target: 1.08340, the old daily low. Reward is 1.08600 − 1.08340 = 26 pips, so the risk-reward is 2:1.
- Size: on a 10,000 USD account risking 1%, the risk is 100 USD. With about 10 USD per pip per standard lot on EURUSD, that is 100 ÷ (13 × 10) ≈ 0.77 lots.
You can check the numbers with the position size calculator and the risk-reward calculator. Price retraces, wicks to 1.08615, and the next M15 candle closes at 1.08570, below CE: the SIBI is holding. If instead a body had closed above 1.08640, the plan says to cancel or exit, because the gap failed. Either outcome is information worth logging.
The same plan with a BISI
Mirror it for a long. Suppose GBPUSD has a bullish bias, sweeps the Asian low and rallies. Candle 1’s high is 1.27150 and candle 3’s low is 1.27270, so the BISI runs from 1.27150 to 1.27270 (12 pips) and CE is 1.27210. A buy limit at 1.27210 with a stop below the sweep low and a target at the nearest untaken high gives the same structure. Trading involves risk, and no zone works every time, so practise the process on a demo account first.
Entries, stops and targets for SIBI trading
There are three common ways to enter a SIBI or BISI. Pick one and keep it, because mixing them makes your results impossible to read.
Entry options
- Near edge: a limit at the first price of the gap (candle 3’s high for a SIBI). Fills most often, gives the worst price and the widest stop.
- CE: a limit at the midpoint. The standard ICT choice; a fair balance between fill rate and price.
- Far edge or confirmation: wait for price to reach deep into the gap, then enter on a lower-timeframe shift back in your direction. Fewer fills, tighter risk.
Stop placement
The conservative stop sits beyond the swing that started the displacement, usually the sweep high for a SIBI or the sweep low for a BISI, because that level invalidates the idea. A tighter stop just beyond the far edge of the gap (candle 1’s low plus a buffer for a SIBI) improves risk-reward on paper but is hit more often by normal wicks.
Targets
Aim at liquidity. For a SIBI short, the first target is the nearest untaken swing low; the final target is the larger sell-side pool your higher-timeframe bias points at. For a BISI long, use the nearest untaken high and then the bigger buy-side target. An opposing imbalance, a BISI below a short or a SIBI above a long, is a sensible place to take partial profit because price often stalls when it reaches the next gap. The liquidity sweep guide explains how to mark those pools.
Variations and related ICT concepts
SIBI and BISI sit inside a wider family of imbalances and PD arrays. Knowing the neighbours keeps you from mislabelling what you see.
- Balanced price range (BPR): a SIBI and a BISI that overlap, usually after a sharp move one way and an equally sharp move back. The overlap is treated as a strong reaction zone.
- Inverse FVG: a SIBI that price closes through becomes possible support, and a broken BISI becomes possible resistance. See the inverse FVG guide.
- Volume imbalance: a gap between two candle bodies where the wicks still overlap. Smaller and weaker than a full SIBI or BISI, but read the same way.
- Liquidity void: a long run of one-sided candles with several gaps stacked together. Price often retraces into it more than once.
- Order block: the last opposite-coloured candle before the displacement. When an order block and a SIBI or BISI come from the same move, the combined zone is stronger.
The most useful link is with market structure. A SIBI created by the candle that breaks a swing low after a sweep is the classic ICT sequence: sweep, displacement, market structure shift, then a return to the imbalance. The PD arrays guide shows where gaps rank among the other reference points.
Timeframes and sessions
A SIBI on the daily or 4-hour chart is a context level; a SIBI on M15 or M5 is an entry level. A common approach is to find a higher-timeframe imbalance first and then wait for a lower-timeframe one to form inside it. Lower-timeframe gaps that form during the London or New York sessions tend to carry more weight than those printed in quiet Asian hours. The Kill Zone time converter shows those windows in your own time zone.
Common SIBI and BISI mistakes
- Reversing the names. SIBI is bearish and BISI is bullish. If you cannot remember, look at the first word: “sell-side imbalance” means sellers drove the move down.
- Counting body gaps as SIBI or BISI. The gap is wick to wick between candles 1 and 3. A body-only gap is a volume imbalance.
- Trading every gap. A gap with no displacement, no structure break and no liquidity behind it is noise.
- Fighting the bias. Selling a SIBI in a strong daily uptrend means trading against the larger flow. Most of the edge comes from gaps that agree with the higher timeframe.
- Ignoring location. A SIBI deep in discount or a BISI deep in premium is a weak short or long, because price is already cheap or expensive.
- Reading wicks instead of closes. A wick above CE in a SIBI is normal; a body close above the gap is the warning.
- Using already-traded gaps. Once price has closed through the far edge, the zone has done its job or flipped. Treat it as a different setup.
SIBI and BISI checklist
Run through this list before placing the order. If more than one item is a “no”, skip the trade.
- The higher-timeframe bias agrees with the gap: bearish for a SIBI, bullish for a BISI.
- The displacement followed a sweep of liquidity on the opposite side.
- The displacement broke a swing point in the direction of the gap.
- The wicks of candles 1 and 3 do not overlap, and the box is drawn wick to wick.
- The gap sits in premium for a SIBI or in discount for a BISI.
- The gap is fresh: price has not closed through it yet.
- Entry (edge, CE or confirmation), stop and target are written down before price arrives.
- The target is a liquidity pool with at least 2R of room, checked against the next opposing gap.
After the trade, record which entry type you used, whether bodies respected CE, and the result in R. After 30–50 trades the data shows whether your SIBI entries or your BISI entries pay, and at which entry point. An ICT trading journal with a tag for each makes that review take minutes.
FAQ
What does SIBI mean in trading?
SIBI means sell-side imbalance, buy-side inefficiency. It is ICT’s name for a bearish fair value gap: a three-candle range left by a fast drop, where the low of candle 1 is above the high of candle 3. On a retracement it is expected to act as resistance.
What is BISI in ICT?
BISI means buy-side imbalance, sell-side inefficiency. It is a bullish fair value gap: the high of candle 1 is below the low of candle 3 after a strong rally. When price pulls back into it, the zone is expected to act as support.
Is a SIBI the same as a bearish FVG?
Yes. The shape on the chart is identical. SIBI is the ICT term that describes what happened inside the gap: sellers were filled and buyers were skipped. A BISI is the same as a bullish FVG.
Where do you enter a SIBI?
Most ICT traders use a sell limit at consequent encroachment, the 50% midpoint of the gap, with a stop above the swing high that started the drop. Some enter at the near edge for more fills; others wait for confirmation deep inside the gap.
What happens when price closes through a SIBI?
The gap has failed as resistance. Price may then use it as support on the next retest, which ICT calls an inversion or inverse FVG. A BISI that price closes below can flip into resistance in the same way.