Fair Value Gap (FVG) Trading: Complete ICT Strategy Guide
How to mark bullish and bearish FVGs, use the 50% line and inversion gaps, and plan entry, stop and target, plus which gaps to skip.
Fair value gap (FVG) trading means waiting for price to return into a three-candle imbalance left by a strong move and entering there in the direction of that move. This guide covers how to mark bullish and bearish FVGs, why the 50% line (consequent encroachment) matters, what an inversion FVG is, and a complete entry, stop and target plan. It also lists the gaps worth skipping, which is where most of the edge is kept or lost. Every rule below is something you can log and test in the LSG Club trading journal.
What a fair value gap is
A fair value gap is a price range that was traded in only one direction. It forms over three consecutive candles: the middle candle moves so fast that the wicks of the first and third candles never overlap. The space between those two wicks is the FVG. Inside it, price was offered to only one side of the market, which is why ICT calls it an inefficiency and expects price to come back and rebalance it.
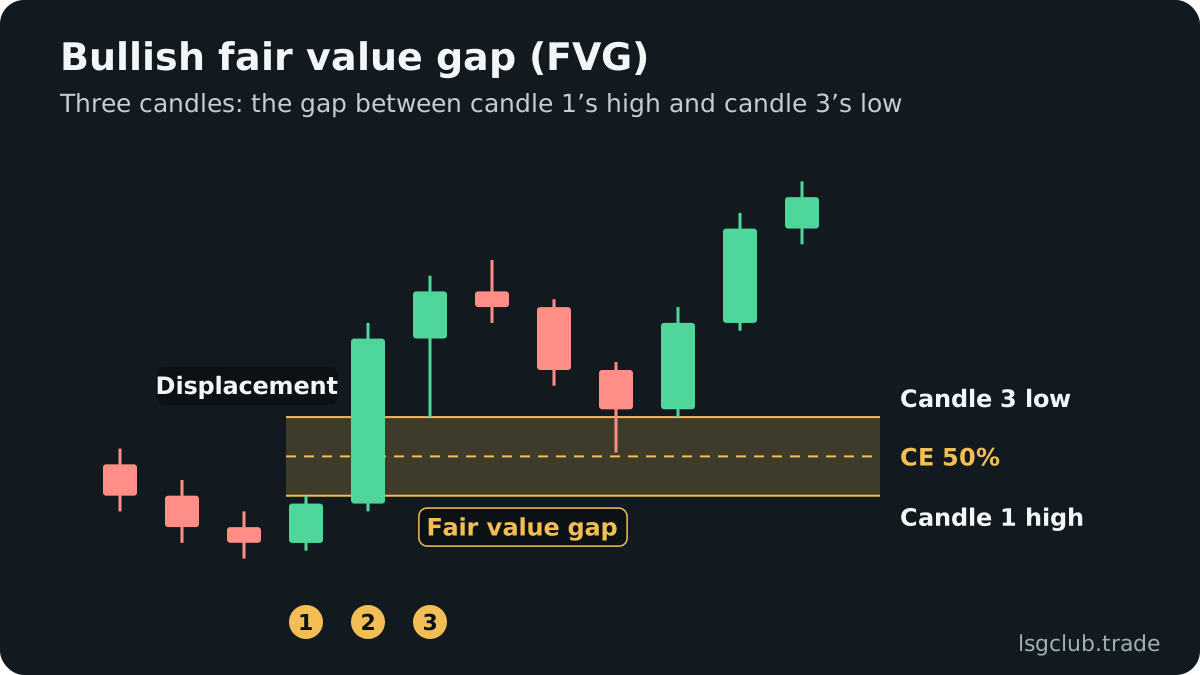
The middle candle should be a displacement candle: a large, decisive body, clearly bigger than the candles around it. Displacement is the footprint of aggressive orders. A gap left by a sleepy drift in a range is technically an FVG, but it carries no information about intent.
Bullish FVG
A bullish FVG appears when the low of candle 3 is above the high of candle 1. The gap runs from the candle 1 high (bottom of the zone) to the candle 3 low (top of the zone). ICT also calls it a BISI: buy-side imbalance, sell-side inefficiency. When price retraces into it, the zone is expected to act as support.
Bearish FVG
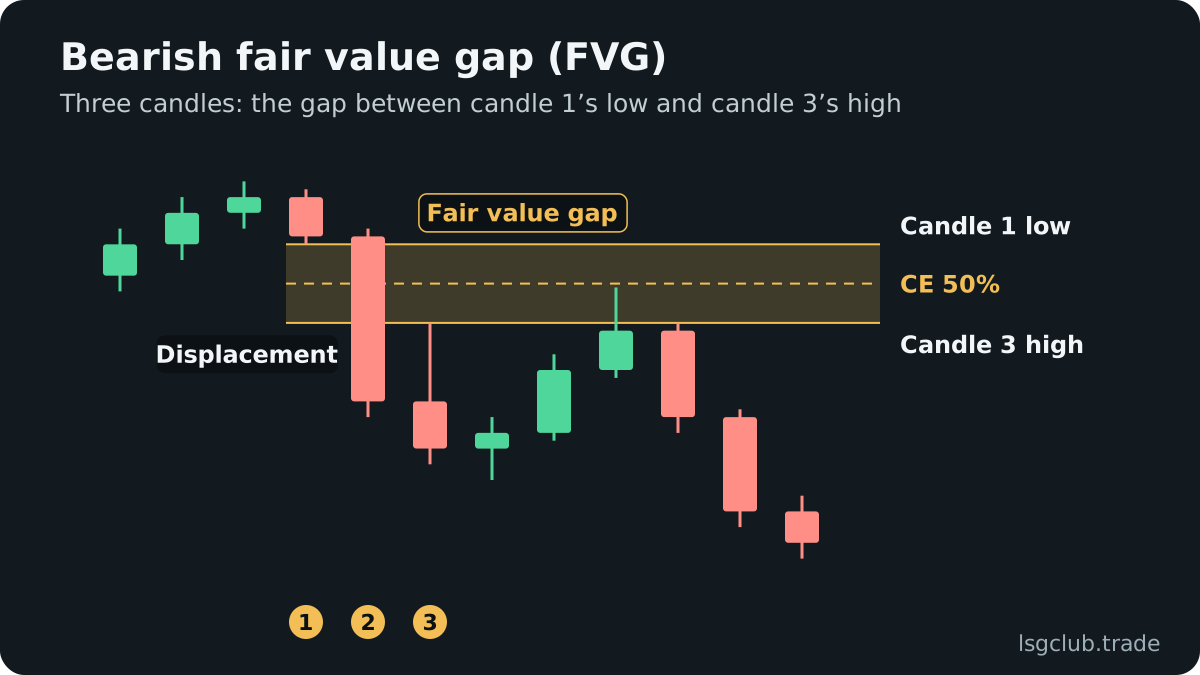
A bearish FVG is the mirror image: the high of candle 3 is below the low of candle 1. The zone runs from the candle 3 high (bottom) to the candle 1 low (top), and ICT calls it a SIBI: sell-side imbalance, buy-side inefficiency. On a retracement it is expected to act as resistance.
How to spot a tradable FVG on the chart
Charts are full of small gaps, so the skill is not finding FVGs but filtering them. A gap is worth your attention when most of these conditions are true:
- Displacement — the middle candle is large relative to recent candles or to ATR, and closes near its extreme.
- Context — the move that left the gap swept liquidity first (an old high or low) and then broke structure.
- Location — a bullish gap sits in the discount half of the dealing range, a bearish gap in the premium half.
- Freshness — price has not traded back into the gap yet; the first return is the one traders watch.
- Timeframe alignment — the gap points the same way as the higher-timeframe bias and the draw on liquidity.
- Clean size — wide enough to hold an order and a stop, narrow enough that the stop does not wreck the risk-reward.
The structure part matters most. A gap created by the move that produced a market structure shift after a liquidity sweep tells you the market just changed hands. A gap in the middle of a range tells you very little.
Consequent encroachment: the 50% line of the gap
Consequent encroachment (CE) is the midpoint of the fair value gap. ICT treats it as the most sensitive level inside the zone. In a strong bullish FVG, price often taps into the gap, reaches roughly the CE, and continues higher without ever trading to the bottom of the zone.
CE gives you two practical tools. First, an entry level: a limit order at the midpoint gives a better price than the top edge and a tighter stop than a full fill. Second, a health check: if candle bodies close beyond the CE (below it in a bullish gap, above it in a bearish one), the gap is weakening, and a close beyond the whole zone usually means it has failed.
Inversion FVG: when a gap flips sides
An inversion fair value gap (IFVG) is a gap that failed and changed roles. If price closes decisively through a bullish FVG, the zone that was supposed to be support often becomes resistance on the next retest. The reverse applies to a bearish FVG that price closes above.
Inversions are useful because they usually appear right after a shift in order flow. A typical sequence: price sweeps a high, drops with displacement through the last bullish FVG, then pulls back into that same zone from below. The retest of the inverted gap becomes the short entry, with the stop above the high of the zone.
FVG trading strategy: entry, stop and target
The setup below is a complete, repeatable plan. It is written for a bullish trade; flip every step for a short.
Step-by-step entry
- Set the daily bias and mark the draw on liquidity, for example an untouched old high or a higher-timeframe bearish gap above price.
- Draw the current dealing range and confirm price is trading in discount.
- Wait for price to sweep sell-side liquidity below a recent low.
- Wait for a displacement candle that breaks the last lower-timeframe swing high and leaves a bullish FVG.
- Place a limit order at the top of the gap or at its consequent encroachment, decided before the session starts.
- Cancel the order if price reaches your target without filling it, or if the session window you trade closes.
Stop placement
The conservative stop goes below the swing low that made the sweep, because that low is what invalidates the idea. A tighter stop goes just below candle 1 of the gap. The tighter stop improves the risk-reward on paper but gets hit more often by normal wicks, so choose one version and keep it fixed long enough to measure it. Size the position from the stop distance, never the other way around.
Targets
The first target is the nearest opposing liquidity: the most recent swing high that the structure break did not take. The final target is the draw on liquidity you marked in step one. An opposing bearish FVG above price works as a target too, because price often stalls when it reaches the next imbalance. Our guide to risk-reward in ICT trading covers how to split partials between these levels.
Worked example: a London session long (illustration)
This is a teaching example, not a trade record. EURUSD has a bullish daily bias and an untouched old high above price. In the London Kill Zone (02:00–05:00 New York time), price drops below the Asian session low, sweeping the sell-side liquidity resting there.
A large M15 bullish candle then breaks the last swing high and leaves a gap between the high of the candle before it and the low of the candle after it. The trader places a limit at the CE of that gap, a stop below the sweep low, a first target at the pre-London high and a final target at the old daily high. If price closes below the gap before the order fills, the setup is cancelled. The same plan written as a checklist is what fits into a trading journal template.
Which FVGs to skip
Most losing FVG trades are not bad entries but bad gaps. These are the ones to leave alone:
- Gaps against the bias — a bullish FVG while the daily draw is a low below price.
- Gaps in the wrong half of the range — buying a bullish FVG in premium means buying expensive.
- Gaps without a sweep or structure break — they come from noise, not from a change in order flow.
- News-spike gaps — a release candle leaves huge gaps that are often fully retraced.
- Gaps already traded into — after the first or second return, the imbalance is largely rebalanced.
- Micro gaps — a gap smaller than the spread plus a sensible stop buffer cannot hold a trade.
- Gaps far from the session window — an FVG formed in thin hours and filled in thin hours often goes nowhere.
When an FVG overlaps an order block from the same displacement, the zone is stronger. The order block trading guide explains how to tell a valid block from a random candle.
How to journal FVG trades
Log every FVG trade with the same fields: timeframe of the gap, whether a sweep came first, entry at the edge or the CE, stop version, session, and result in R. After a few dozen trades you can answer specific questions with your own numbers: does a CE entry miss too many moves, does the tight stop survive, which session produces your best gaps. Trading involves risk, and no FVG rule works every time; the journal shows which version of the rule works for you.
Two FVG ideas get their own guides: SIBI and BISI, ICT’s names for the bearish and bullish gap, and the inverse FVG, a gap that price closes through and that then flips its role.
FAQ
What timeframe is best for FVG trading?
There is no single best timeframe. A common approach is to take the bias and the draw on liquidity from H4 or daily gaps and enter on M5 or M15 gaps that form inside the higher-timeframe zone. Higher-timeframe gaps carry more weight, lower-timeframe gaps give tighter stops.
Does price always fill a fair value gap?
No. Strong trends leave gaps that stay open for a long time, and some are never revisited. That is why an FVG is an area to watch with conditions, not a promise that price will return.
What is the difference between an FVG and an order block?
An FVG is the empty space between candle 1 and candle 3 of a displacement. An order block is the last opposite-colored candle before that displacement. They often form in the same move, one just above the other, which is why traders combine them.
Should I enter at the top of the FVG or at the 50% level?
Entering at the edge fills more often; entering at consequent encroachment gives a better price and a smaller stop but misses fast moves. Test both in your journal and keep the one with the better expectancy in R.