Risk-Reward Ratio in ICT Trading: Why 1:2 Is Not Enough
Why a 1:2 ratio means nothing without your win rate: break-even math, liquidity-based targets, stop placement, and how to measure the RR you really get.
A 1:2 risk-reward ratio in ICT trading tells you only half of what you need to know. Whether it makes money depends on how often those trades win, how much costs and early exits shave off each winner, and whether the target sits where price is actually likely to go. This guide from LSG Club shows how to calculate the win rate your ratio needs, how ICT traders let the chart set the stop and target, and how to measure the RR you really get instead of the one you planned.
What the Risk-Reward Ratio Actually Measures
Risk-reward compares the distance to your stop with the distance to your target. Risk 20 pips to make 40 and the trade is planned at 1:2. Traders usually express this in R, where 1R is the amount you lose if the stop is hit at full size. A +2R trade made twice what it risked; a −1R trade lost exactly what was planned.
The ratio you set when you place the order is a plan, not a result. Realized R is what arrives after spread, commission, slippage and your own decisions to close early or move the stop. The two numbers drift apart quietly, and the gap between them is where many accounts leak.
The Break-Even Win Rate for Every Ratio
The minimum win rate a ratio needs is simple arithmetic: break-even win rate = 1 ÷ (1 + R), where R is your average win expressed in multiples of your average loss.
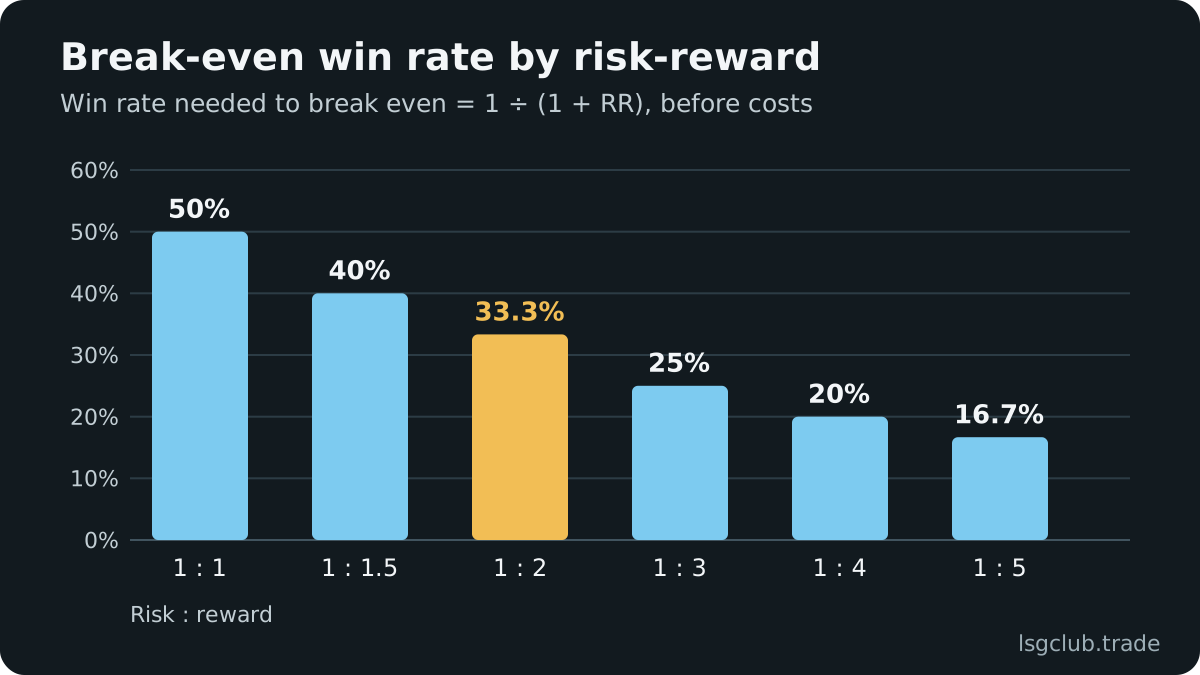
- 1:1 — you must win more than 50% of trades just to break even.
- 1:1.5 — the threshold drops to 40%.
- 1:2 — the threshold is 33.3%.
- 1:3 — the threshold is 25%.
- 1:4 — the threshold is 20%.
Expectancy in R
Expectancy tells you what a trade is worth on average: expectancy (in R) = win rate × average win − loss rate × average loss. Say your account is $10,000, you risk 1% ($100) per trade, you win 40% of the time and your average winner is 2R. Expectancy is 0.4 × 2 − 0.6 × 1 = +0.2R per trade, or about +20R ($2,000) over 100 trades before costs. That is an illustration of the arithmetic, not a forecast.
Now keep the same 40% win rate but let the average winner shrink to 1.5R: 0.4 × 1.5 − 0.6 × 1 = 0. The edge is gone. That is the real meaning of “1:2 is not enough”: a ratio on its own is not an edge. A ratio combined with the win rate you actually achieve at that ratio is. The article on how win rate and risk-reward work together goes deeper into reading the two numbers as a pair.
Why a Fixed 1:2 Rule Breaks Down
Win Rate Falls as the Target Moves Away
Win rate and RR are not independent. Push the target further away and fewer trades reach it; pull it closer and more trades win, but each one pays less. You cannot switch from 1:2 to 1:4 and assume your old win rate comes along. The only way to know your win rate at 1:4 is to measure it.
Costs Hit Tight Stops Hardest
Take an example on EURUSD: an 8-pip stop, a 16-pip target and about 1 pip of spread and commission per round trip. A winner nets 15 pips and a loser costs 9, so the realized ratio is about 1:1.67 and the break-even win rate climbs from 33.3% to 37.5%. The same 1 pip of cost on a 30-pip stop and 60-pip target barely moves the numbers (59 against 31, break-even about 34%). Lower-timeframe entries with very tight stops are far more sensitive to costs than they look on the chart.
Management Shrinks Winners
Moving the stop to break-even at +1R turns some trades that would have reached 2R into scratches. Closing at 1.3R because a candle “looks weak” does the same. Each decision feels prudent in the moment; together they rewrite your expectancy.
Let Liquidity Set the Target, Not the Ratio
In ICT terms, price travels from one pool of liquidity to the next. Buy-side liquidity rests above old highs, where shorts keep their stops and breakout traders place buy orders. Sell-side liquidity rests below old lows. The draw on liquidity is the pool price is most likely heading for next, and that is where your target belongs.
- Previous day high or low — the most common intraday draw, and easy to mark before the session.
- Asian range high or low — often swept during London; the untouched side can become the target.
- Equal highs or equal lows — obvious resting liquidity that price tends to seek out.
- Unfilled higher-timeframe FVG — an imbalance price often returns to rebalance.
- Previous week high or low — the natural draw for swing trades held over several days.
Mark the target first, then calculate the ratio from your stop to that level. If the nearest realistic pool only offers 1:1.4, the trade either fails your minimum or needs a better entry. If it offers 1:5, do not cut it to 1:2 because a rule says so; consider taking a partial at an intermediate pool instead.
Location does much of the work. Buying in discount, below the 50% equilibrium of the dealing range, with a target in premium gives you room by construction. Buying in premium toward a nearby high gives a poor ratio before you even place the stop. The guide to ICT premium and discount zones shows how to draw the range.
Where the Stop Belongs
Stop at the Point of Invalidation
Never manufacture RR by shrinking the stop. The stop goes where your idea is proven wrong. For a long after sell-side liquidity has been taken, that is beyond the low of the sweep, or beyond the swing low that launched the displacement leg. A stop placed inside normal noise raises the planned ratio and lowers the win rate, usually by more. If you need a refresher on reading the raid itself, see how a liquidity sweep forms.
Improve the Entry Instead
After the market structure shift, wait for price to retrace into the fair value gap left by displacement, or into the optimal trade entry zone at the 62–79% retracement of the leg, with 70.5% as its midpoint. Same invalidation, closer entry, better ratio. The cost is that some trades never retrace and you miss them; that is a trade-off to measure, not to guess.
Size From the Stop
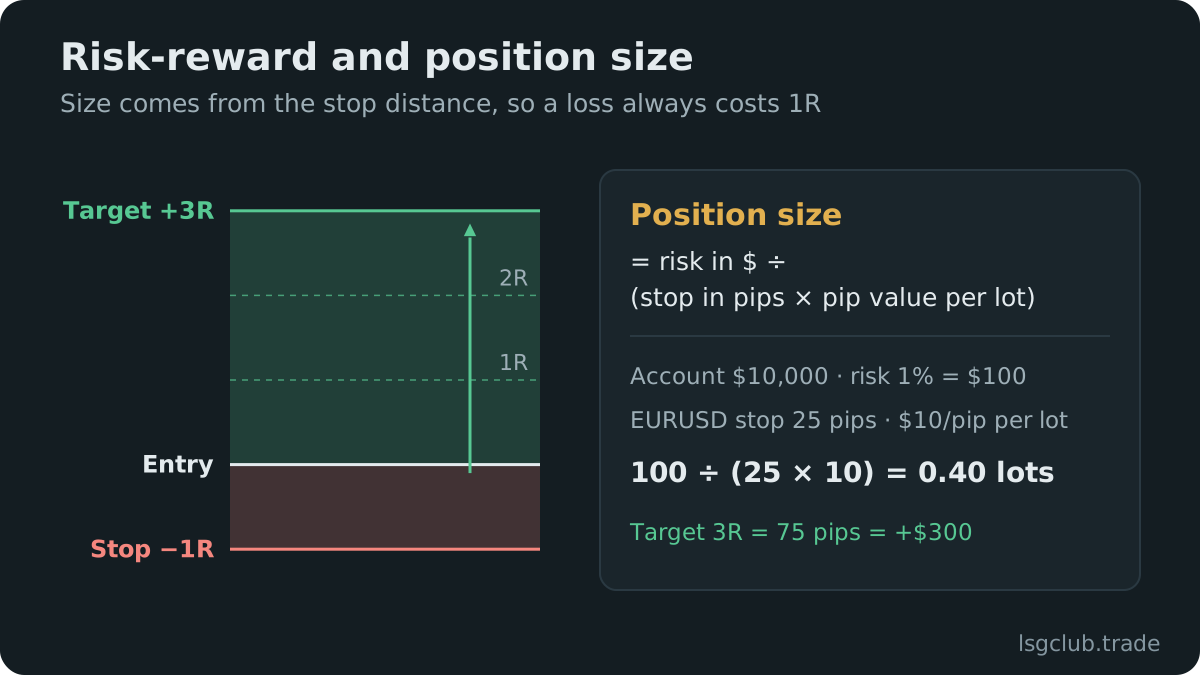
Position size follows the stop, never the other way round. Size = money at risk ÷ (stop in pips × pip value). With the same $10,000 example, 1% risk ($100) and a 20-pip stop on EURUSD, where a standard lot is worth about $10 per pip, the size is 0.5 lots. The full method is in how to calculate position size.
Partial Closes and Break-Even: Run the Numbers
Partials change the shape of your results, so model them before adopting them. Example: close half at 1R and hold the rest for 3R. If both halves hit, the trade makes 0.5 × 1 + 0.5 × 3 = 2R. If the runner comes back to a break-even stop, the trade makes 0.5R. Holding the full position to 3R produces either +3R or −1R. Which version earns more depends entirely on how often each path happens in your own trades.
Treat the break-even move the same way. Count the trades that were stopped at entry and then went on to hit the original target. If that list is long, your break-even trigger is too early. A journal that replays your trades on real candles can show what different break-even triggers and target distances would have produced on your own history, which beats any rule of thumb.
Measure Realized RR, Not Planned RR
- Planned vs realized R — the average gap between the target you set and where you actually closed.
- Win rate by target distance — trades aimed at 1–2R, 2–3R and 3R+ tracked separately.
- R by session — the same setup can behave differently in the London and New York Kill Zones.
- R by setup — sweep plus FVG entries against order block entries, for example.
- Cost per trade in R — spread and commission as a fraction of 1R.
- Early exits — trades closed before stop or target, and what price did afterwards.
If you compare sessions, state which clock you use. ICT defines the London Kill Zone as 02:00–05:00 and New York AM as 07:00–10:00 New York time; the LSG journal tags trades with the same New York-time windows, which move by an hour in UTC when US daylight saving changes. Collect a few dozen trades per bucket before drawing conclusions, because small samples swing wildly.
Common Mistakes
- Choosing the ratio first — then hunting for a chart that fits it, instead of reading the draw on liquidity.
- Shrinking the stop to reach 1:3 — the stop ends up inside normal noise and the win rate collapses.
- Ignoring costs on tight stops — a planned 1:2 can be closer to 1:1.6 once spread and commission are paid.
- Moving the target mid-trade — extending it because the move feels strong, or cutting it because it feels slow.
- Judging a ratio on ten trades — any ratio can look brilliant or broken over a handful of results.
- Raising risk to compensate for low RR — this increases drawdown without fixing expectancy.
Prop challenges make these mistakes more expensive. A typical two-step challenge has a daily loss limit of around 5% and an overall limit of around 10%, but rules differ and change, so check your firm’s current terms. With fixed loss limits, a strategy with a low win rate and high RR can hit a limit during an ordinary losing streak; see how to track a prop firm challenge.
Pre-Trade RR Checklist
- Target is a named liquidity level — previous day high, Asian low, equal highs, or similar.
- Stop sits beyond the sweep or the swing — where the idea is invalid, not where the ratio looks good.
- Ratio after costs meets your minimum — calculated with spread and commission included.
- Entry is in the right zone — discount for longs, premium for shorts.
- Size comes from the stop distance — fixed percentage risk, no exceptions for conviction.
- Management is written down — partial and break-even rules decided before entry.
Trading involves real risk of loss, and no ratio guarantees a profitable result. What a ratio can do is make your expectancy visible, as long as you record every trade honestly. You can see how trades with stop and target zones look in the journal demo with sample data. The free risk-reward calculator gives the R:R of a trade, the win rate it needs to break even and the expectancy of a strategy.
FAQ
What is a good risk-reward ratio for ICT trading?
There is no universal number. A ratio is good when your win rate at that ratio, after costs, gives a positive expectancy. Many ICT traders require at least 2R to the first liquidity target as a filter, but only your own records can show whether that minimum works for your setups.
How do you calculate the risk-reward ratio of a trade?
Divide the distance from entry to target by the distance from entry to stop. A 20-pip stop and a 50-pip target is 1:2.5. For a realistic figure, add spread and commission to the risk and subtract them from the reward.
Is a higher risk-reward ratio always better?
No. A more distant target is reached less often, so the win rate falls as the ratio rises. A 1:5 plan that rarely hits its target can earn less than a 1:2 plan that hits often. Compare expectancy, not the ratio alone.
What win rate do I need with a 1:2 ratio?
At least 33.3% to break even before costs, from the formula 1 ÷ (1 + R). Spread, commission and early exits push that threshold higher, especially with tight stops, so measure the ratio you actually realize.