ICT Optimal Trade Entry (OTE): How to Pick the Swing and Enter
Pick the right swing for an ICT OTE: three worked examples (correct, internal swing, no setup) with every 62/70.5/79% price, stop and target placement, FVG refinement and when to skip.
Optimal Trade Entry (OTE) is ICT’s method for entering a retracement between 62% and 79% of a displaced swing, with 70.5% as the midpoint, instead of chasing price. The Fibonacci arithmetic is easy; the hard part is choosing which swing to measure. This guide is built around that decision: three worked examples on gold, EURUSD and NAS100 with every level calculated, one correct swing, one measured on the wrong internal swing and one where no OTE exists. You will also find the exact level set, where the stop and targets go, when to skip the zone and how to refine it with a fair value gap or order block. Every fill can then be reviewed in the LSG Club trading journal.
What OTE is, in one paragraph
After a displaced move that breaks structure in the direction of your bias, price usually retraces part of that move before it continues. OTE names the deep end of that retracement: the band from 62% to 79% of the swing. Entering there puts you close to the point that invalidates the idea, the swing origin, while the distance to the swing extreme stays large. The edge is not a higher win rate but a smaller loss when the idea is wrong. OTE times an entry inside a move you already believe in; it does not create the bias.
Premium, discount and PD arrays in brief
For a long, the OTE band sits deep in the discount half of the swing, below the 50% equilibrium; for a short it sits deep in premium. If you want the full picture of dealing ranges, equilibrium and why buying below the midpoint matters, the premium and discount guide covers it instead of repeating it here.
The things that make an OTE band hold, such as fair value gaps, order blocks and breakers, are PD arrays. How they are ranked in premium and discount is explained in the ICT PD arrays guide.
The OTE levels and what each one does
Draw the Fibonacci tool on the impulse leg so that 1 is the swing origin (the sweep low of a bullish leg, the sweep high of a bearish one) and 0 is the swing extreme the impulse reached. For a long measured from low to high, each level is high − (high − low) × ratio. For a short measured from high to low, it is low + (high − low) × ratio. Keep these levels on the tool and remove the rest:
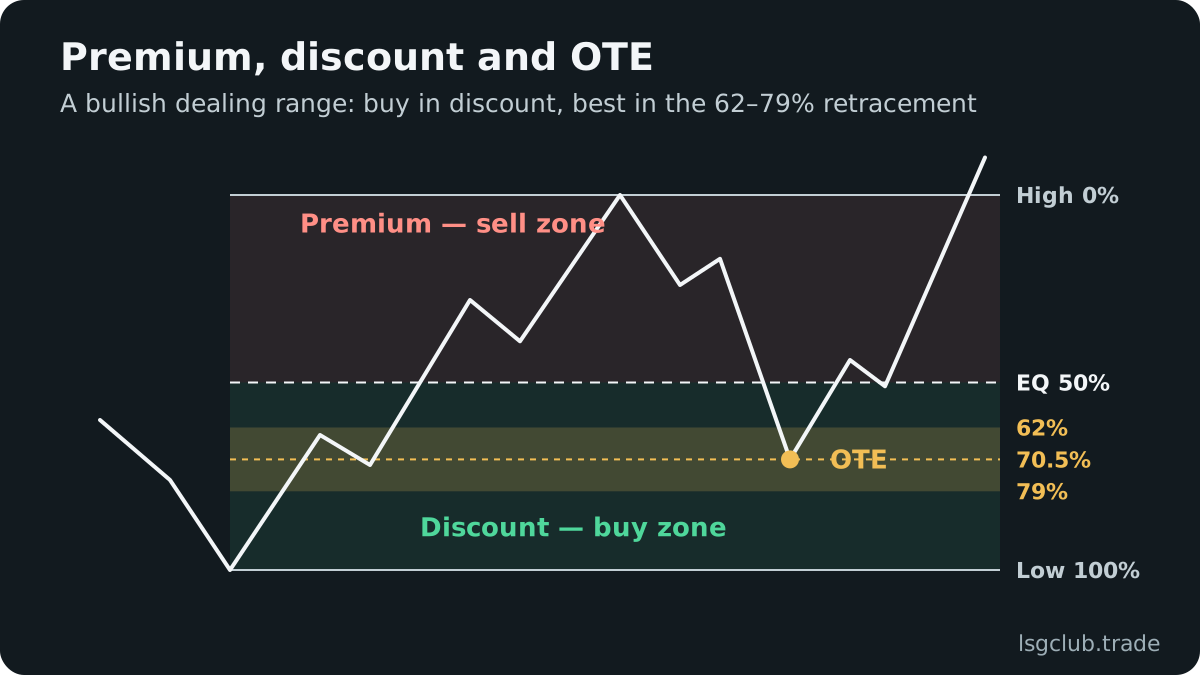
- 0 — the swing extreme. It is the first target and the reference point for the extensions.
- 0.5 — equilibrium. Any entry above it on a long (below it on a short) is not an OTE.
- 0.62 — the shallow edge of the zone. Fills here are frequent but give the smallest ratio.
- 0.705 — the midpoint and the usual single limit price.
- 0.79 — the deep edge. Fills here are rarer but carry the largest ratio.
- 1 — the swing origin. The stop goes beyond it, never at 79%.
- −0.27 — an extension 27% of the leg beyond the swing extreme. Many ICT traders use it as the first projected target after the old high or low.
- −0.62 — an extension 62% of the leg beyond the swing extreme, a second projected target for the rest of the position.
The extensions are projections, not levels the market owes you. If the next buy-side liquidity sits before the −0.27 extension, the liquidity is the better target.
One setup trap: some platforms draw the Fibonacci with 0 at the starting point. Then the same zone reads 0.38, 0.295 and 0.21. Set the tool once so that 0.62, 0.705 and 0.79 appear by name.
What the levels mean for risk to reward
If the stop sits exactly on the swing origin and the target is the swing extreme, the ratio depends only on where you are filled. A small buffer for spread lowers each figure slightly:
- Entry at 62%: risk 0.38 of the leg, reward 0.62 — about 1.6R.
- Entry at 70.5%: risk 0.295, reward 0.705 — about 2.4R.
- Entry at 79%: risk 0.21, reward 0.79 — about 3.8R.
- Entry at 70.5% with the target at the −0.27 extension: reward 0.975 — about 3.3R.
This is why ICT traders prefer the middle and deep parts of the band, and why an entry at 50% or above is a different trade with a worse ratio. You can check other combinations with the risk-reward calculator.
How to pick the right swing to measure
Almost every bad OTE is a correct calculation on the wrong two points. Before you touch the tool, the leg should pass four tests:
- Direction: the leg runs with your higher-timeframe bias. A bullish leg for a bullish daily bias, a bearish leg for a bearish one.
- Origin at a sweep: the 1 anchor is the extreme that took liquidity, such as a previous day’s low or the Asian range high, and then reversed. The liquidity sweep guide shows what that looks like.
- Displacement through structure: the leg closes through a recent swing point with large, one-directional candles, ideally leaving a fair value gap. That is a market structure shift or a clean continuation break.
- The protected extreme: the 1 anchor is the price that, if traded through, proves the idea wrong. If you would not put your stop beyond it, it is not the origin.
The 0 anchor is the highest high (for a long) reached by that displacement before the pullback started. Do not wait for a later, higher high to redraw the tool: once price starts retracing, the anchors are fixed until the trade is taken, missed or invalidated.
The examples below use illustrative prices chosen to show the arithmetic. Each level is rounded the way you would type it into a limit order.
Example 1: gold, the correct swing
Your daily bias on XAUUSD is bullish. During the London session gold trades below the previous day’s low at 2,642.50, prints a low at 2,640.00 and reverses. The rally is displaced: three large candles close through the last swing high at 2,661.00 and reach 2,672.00, leaving a fair value gap between 2,648.00 and 2,651.50.
The leg is 2,640.00 to 2,672.00, a range of 32.00. Using high − range × ratio:
- 50% equilibrium: 2,672.00 − 16.00 = 2,656.00.
- 62%: 2,672.00 − 19.84 = 2,652.16.
- 70.5%: 2,672.00 − 22.56 = 2,649.44.
- 79%: 2,672.00 − 25.28 = 2,646.72.
- −0.27 extension: 2,672.00 + 8.64 = 2,680.64.
- −0.62 extension: 2,672.00 + 19.84 = 2,691.84.
The fair value gap, 2,648.00–2,651.50, sits inside the band and contains the 70.5% level, so the zone has a specific reason to hold. A buy limit at 2,649.44 with the stop at 2,638.50, 1.50 below the sweep low, risks 10.94. The swing high at 2,672.00 is 22.56 away, about 2.1R. The −0.27 extension is 31.20 away, about 2.9R, and the −0.62 extension 42.40 away, about 3.9R.
With a $10,000 account and 1% risk, the budget is $100. On a standard gold contract of 100 ounces, a 1.00 move is $100 per lot, so 10.94 of risk costs $1,094 per lot and the size is 0.09 lots, a real risk of about $98. The position size guide and the position size calculator do the same sum for other instruments; trading gold with ICT covers the instrument’s sessions and spreads.
Example 2: EURUSD, the wrong (internal) swing
Your bias on EURUSD is bearish. In the London session price runs above the Asian high and prints 1.0950, then displaces lower. On the way down it breaks the last swing low at 1.0880, pauses at 1.0870, bounces to an internal lower high at 1.0905 and drops again to 1.0830. Then the retracement begins.
A trader who anchors on the most recent bounce measures 1.0905 to 1.0830, a range of 75 pips. Using low + range × ratio, that internal leg gives 62% at 1.08765, 70.5% at 1.0883 and 79% at 1.0889, with a stop just above 1.0905, say 1.0910.
The correct leg starts at the sweep high, the price that protects the bearish idea: 1.0950 to 1.0830, a range of 120 pips.
- 50% equilibrium: 1.0830 + 0.0060 = 1.0890.
- 62%: 1.0830 + 0.00744 = 1.0904.
- 70.5%: 1.0830 + 0.00846 = 1.0915.
- 79%: 1.0830 + 0.00948 = 1.0925.
- −0.27 extension: 1.0830 − 0.00324 = 1.0798.
- −0.62 extension: 1.0830 − 0.00744 = 1.0756.
Compare the two. The internal zone, 1.0877–1.0889, lies entirely below the true equilibrium at 1.0890: it is a short in the discount half of the real leg. Its stop at 1.0910 sits inside the correct OTE band. If price retraces normally to 1.0915, the 70.5% of the real leg, the trader on the internal swing is stopped out five pips before the price where the correct entry was filled, and then watches the move continue lower.
The correct trade is a sell limit at 1.0915 with the stop at 1.0955, five pips above the sweep high, for 40 pips of risk. The swing low at 1.0830 is 85 pips away, about 2.1R; the −0.27 extension at 1.0798 is 117 pips away, about 2.9R. The anchor must be the extreme whose break ends the idea, and an internal lower high 45 pips under the sweep does not end it.
Example 3: NAS100, no valid OTE
Your bias on NAS100 is bullish. In the New York morning the index climbs from 21,380 to 21,560 over two hours in small, overlapping candles. It never took the overnight low, it did not close through the prior swing high at 21,575, and it left no fair value gap.
You can still draw the tool: a range of 180 points gives 50% at 21,470, 62% at 21,560 − 111.6 = 21,448.4, 70.5% at 21,560 − 126.9 = 21,433.1 and 79% at 21,560 − 142.2 = 21,417.8. The numbers are correct, and the zone is meaningless. The leg fails three of the four swing tests: no sweep at the origin, no displacement and no break of structure. The 21,380 low is not protected by anything.
A buy at 21,433 here is a bet on a drift, not a retracement of displaced order flow. Price slips through 21,380 to the untaken overnight low below. The right decision was no trade, logged as a skipped setup with the reason.
Step by step: placing a bullish OTE
- Write down the daily and 4-hour bias and the draw on liquidity above price.
- Wait for a sweep of sell-side liquidity, ideally inside a Kill Zone.
- Confirm displacement through the last short-term high on the 5- or 15-minute chart.
- Anchor 1 on the sweep low and 0 on the high of the displacement; check the four swing tests.
- Mark any fair value gap or order block inside or overlapping 62–79%.
- Place the limit at 70.5% or at the edge of the array inside the zone; put the stop beyond the sweep low plus the spread.
- Size the position from that stop distance, then set targets: the swing high first, then the −0.27 extension or the next buy-side liquidity, whichever comes first.
For a short, mirror every step: a sweep of buy-side liquidity, a shift down, the tool anchored from the sweep high to the displacement low and the stop above the sweep high.
Stop and target placement
Where the stop goes
The stop sits beyond the 1 level, the swing origin, with a buffer for the spread and normal noise: a few pips on EURUSD, a dollar or two on gold, a few points on an index. Price often pierces 79% and still respects the origin, so a stop just past 79% turns many valid trades into losses. If the distance to the origin is too large for your risk budget, reduce the position size or skip the trade; do not move the stop inside the zone.
Where the targets go
The first target is the swing extreme, level 0, because it is a known high or low with resting orders above or below it. A common plan takes partial profit there, then aims the rest at the −0.27 or −0.62 extension or the next pool of liquidity, whichever the chart supports.
Refining the zone with an FVG or order block
The 62–79% band is wide: 17% of the leg, or 5.44 on the gold example. A PD array inside it narrows the entry and explains why price should turn at that exact place.
- Fair value gap inside the zone: the most common refinement. The gap left by the displacement is where the move was most one-sided. Enter at the gap’s near edge or its midpoint and keep the stop beyond the origin. The FVG trading guide explains how to grade a gap.
- Order block inside the zone: the last opposite candle before the displacement. If it overlaps the band, its open or mean threshold can be the limit price. See the order block guide.
- Array at 62% only: accept the smaller ratio or skip; do not invent a deeper array.
- Array outside the zone: an FVG at 45% is not an OTE entry; treat it as a different setup.
When an FVG and the 70.5% level overlap, as in the gold example, you have two independent reasons pointing to one price. That overlap is the setup most ICT traders look for; a bare Fibonacci level is the weakest version of OTE.
When OTE fails, and when to skip it
Skip or cancel the setup in these cases:
- The leg fails the swing tests: no sweep at the origin, no displacement or no break of structure, as in the NAS100 example.
- The retracement turns before 62%: if price reverses at 55% and runs, the trade is missed. Chasing it at market removes the ratio the model is built on.
- Price closes beyond the origin: a body close past the 1 level on your entry timeframe invalidates the leg. Cancel unfilled orders and redraw only after a new sweep and displacement.
- Counter-trend legs: a clean OTE against the daily bias is still a counter-trend trade.
- Slow, grinding retracements: a pullback that drifts for hours into a quiet session often turns into a reversal rather than a continuation.
- High-impact news inside the trade window: price can jump through the band and the stop in one candle.
- Redrawing after the fact: if the anchors change, it is a new trade with a new reason.
OTE across timeframes
The tool is the same on every chart. A daily or 4-hour OTE marks a swing entry area that can take days to reach; a 5- or 15-minute OTE refines the entry inside a Kill Zone. A practical sequence is to wait for price to trade into the higher-timeframe band, then measure a fresh OTE on a lower-timeframe sweep and shift inside it. The smaller stop allows a larger size for the same risk, but the higher-timeframe origin still invalidates the bigger idea.
OTE checklist
- Bias and draw on liquidity written down.
- The leg passes the four swing tests; anchors fixed once the retracement starts.
- 62%, 70.5% and 79% typed in as prices, with an FVG or order block inside the band.
- Stop beyond the origin plus spread; size from that distance.
- Targets: the swing extreme, then the −0.27 extension or the next liquidity.
- No high-impact news during the expected holding time.
Review your OTE fills in a journal
OTE gives you a band, not one price, so your own data should settle the details. Log the level that filled you (62%, 70.5%, 79% or the array edge), the anchors you used, how far price moved against you before it worked and whether the trade reached the swing extreme or the extension. Log skipped setups too. After 30 or more trades you can see whether deeper entries miss too many moves and whether your losers share one anchoring mistake.
The LSG journal’s optimal RR and optimal break-even replays run on real candles, so you can see where your OTE trades usually ran out of momentum and whether moving the stop to break-even helped or hurt. Logging is free once you join the club. Trading carries risk: a well-placed entry limits the loss, it does not remove it.
FAQ
Is the OTE zone the same as the 61.8% golden ratio?
It starts close to it. ICT’s zone begins at 62%, roughly the classic 61.8% level, but extends to 79% and centres on 70.5%. The aim is to enter deep in the retracement of a displaced leg, not at one special ratio.
Which swing do I measure if there are several?
Measure from the extreme that swept liquidity and started the displacement, the price whose break would prove the idea wrong, to the extreme the displacement reached. Internal pauses inside the leg are not origins. If no extreme took liquidity and no structure was broken, there is no OTE to measure.
Where does the stop go on an OTE trade?
Beyond the swing origin, the 1 level of the leg, which is usually the extreme of the liquidity sweep, plus a buffer for the spread. A stop inside the zone, for example just past 79%, turns many valid setups into losses.
What if price never reaches the 62–79% zone?
Then there is no OTE trade. A retracement that turns at 50% or above means the setup was missed; chasing it at market raises the risk and breaks the model. Record the miss, because a pattern of shallow turns tells you something about the instrument and the session.