Win Rate vs Risk-Reward: Which Number Matters More?
Break-even win rate for each risk-reward ratio, the expectancy formula, worked examples and how many trades you need before the numbers mean anything.
Win rate vs risk-reward is a false choice: neither number means anything on its own, because each one decides how good the other has to be. A 30% win rate can be profitable at 1:3 and a 70% win rate can lose money at 1:0.4. What actually matters is the combination, measured as expectancy over a meaningful sample. This guide from LSG Club shows the break-even math, the expectancy formula and how to read both numbers in your own journal.
Win rate and risk-reward: definitions that hold up in a journal
Both metrics sound simple, but small definition choices change the result. Decide them once and keep them consistent, otherwise week-to-week comparisons are meaningless.
Win rate
Win rate is winning trades divided by all closed trades. The tricky part is break-even trades. If you move stops to entry often, counting break-evens as losses understates your win rate, and leaving them out overstates it. A clean approach is to report three numbers: wins, losses and break-evens, and compute win rate on wins plus losses only.
Risk-reward (R multiple)
Risk-reward is the potential or realized reward divided by the risk taken. Planned RR is measured at entry: distance to target ÷ distance to stop. Realized RR is what you actually got, expressed in R, where 1R is the amount you risked. A trade planned at 1:3 that you closed early at +1.2R is a 1.2R win, not a 3R win. For performance analysis, realized R is the number that counts.
The break-even win rate for each risk-reward ratio
For any fixed risk-reward ratio there is a minimum win rate below which the strategy loses money. The formula is break-even win rate = 1 ÷ (1 + RR), where RR is the average win divided by the average loss. Before spread, commission and slippage, it looks like this:
- 1:0.5 — 66.7% wins needed to break even
- 1:1 — 50%
- 1:1.5 — 40%
- 1:2 — 33.3%
- 1:3 — 25%
- 1:4 — 20%
- 1:5 — 16.7%
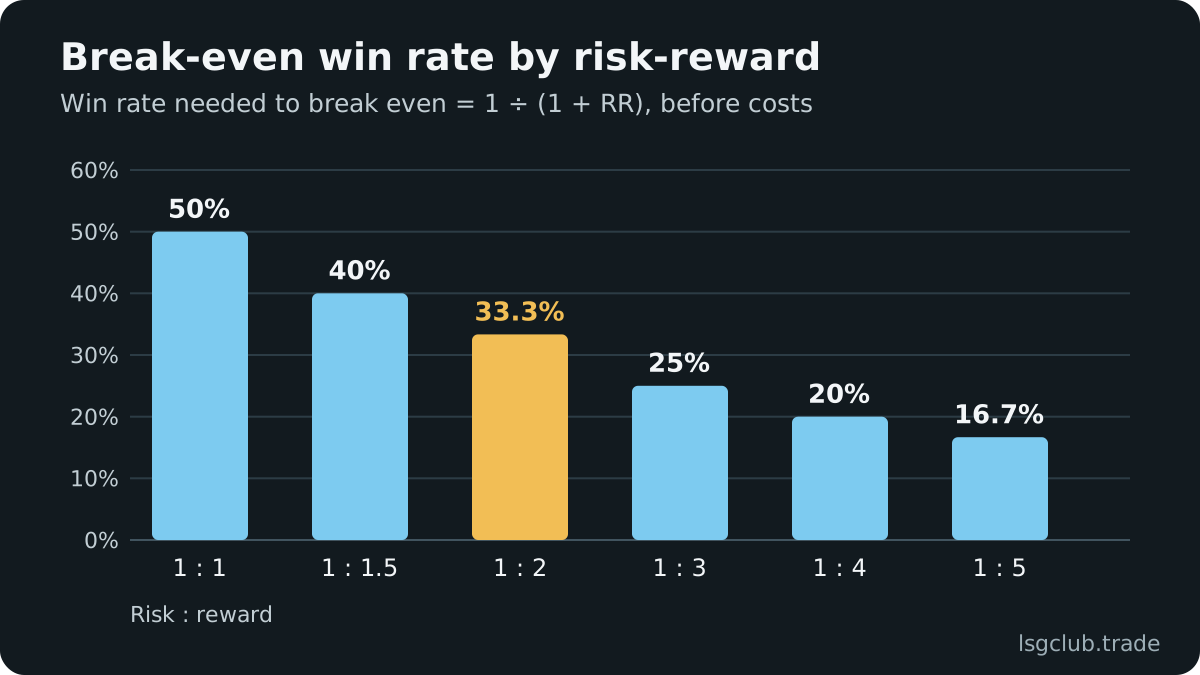
Costs push every one of these numbers up, and they hurt short-stop, low-RR trading the most, because spread and commission are a larger share of a small stop. The table also shows why judging a strategy by win rate alone is risky: 45% is excellent at 1:3 and losing at 1:1.
Expectancy: the number that combines both
Expectancy tells you what one trade is worth on average. In R terms: expectancy = (win rate × average win in R) − (loss rate × average loss in R). If your losses are usually a full 1R, the second part is simply the loss rate. A positive number means the system makes money over many trades; a negative one means it bleeds slowly, however good individual weeks look.
Three examples side by side
The following are hypothetical examples to illustrate the math, not results anyone is claimed to have achieved.
- Example A — 45% wins, average win 2R, average loss 1R: 0.45 × 2 − 0.55 × 1 = +0.35R per trade. Over 100 trades at 1% risk that is roughly +35% before compounding.
- Example B — 70% wins, average win 0.6R, average loss 1R: 0.70 × 0.6 − 0.30 × 1 = +0.12R per trade. Positive, but thin enough that costs or a few slipped stops can erase it.
- Example C — 30% wins, average win 2R, average loss 1R: 0.30 × 2 − 0.70 × 1 = −0.10R per trade. A 2R target is not enough at this hit rate.
Example B is the one that feels best day to day and is often the weakest. Example C shows that a big target alone does not create an edge. Example A is not better because of either number in isolation; it is better because the combination leaves a margin over break-even.
Why win rate vs risk-reward is always a trade-off
The two numbers pull against each other. Move the target further and fewer trades reach it; tighten the stop and more trades get stopped out by noise before the move. You cannot raise one without paying with the other, so the useful question is where your setup sits on that curve.
- Target placement — in ICT terms the target is a draw on liquidity: the old high or low the market is likely to reach. Targets beyond that level raise planned RR on paper while lowering the hit rate in practice.
- Entry precision — entering deeper, for example in the OTE zone of 62–79%, improves RR but means some trades never fill. Missed trades do not appear in win rate, yet they are part of the strategy’s real behavior.
- Management — moving the stop to break-even early converts some losers into scratches and some winners into scratches too. It changes both numbers at once.
- Psychology — a low win rate means long losing streaks. At a 30% win rate, the chance of any given five trades all losing is 0.7⁵ ≈ 17%. If you cannot sit through that, you will abandon the plan before the edge shows up.
This is why the article on the risk-reward ratio in ICT trading argues that a fixed 1:2 is not a strategy by itself: the right ratio is the one your setup can actually reach often enough.
Sample size: how many trades before the numbers mean anything
A win rate from 15 trades is mostly noise. The standard error of a win rate is √(p × (1 − p) ÷ n). At a true 50% win rate and 30 trades, that is about 9 percentage points, so the measured result could reasonably land anywhere from about 32% to 68%. At 100 trades the range narrows to roughly 40–60%.
- Measure per setup — a London sweep-and-FVG entry and a New York continuation trade are different strategies; mixing them hides which one works.
- Aim for 50–100 trades per setup before drawing firm conclusions, and treat anything under 30 as a hint, not a verdict.
- Freeze the rules while you collect the sample — changing the entry every week resets the count.
- Use demo or minimum risk while the sample is small, so the cost of learning stays low.
How to read win rate and RR in your trading journal
Knowing the formulas is easy; getting honest inputs is the hard part. That requires every trade logged with its planned stop, its planned target and the realized result in R, which is what an ICT trading journal template should capture.
- Record results in R, not only in dollars, so trades with different sizes are comparable.
- Compare planned RR with realized RR; a large gap usually points to early exits or late entries.
- Split the numbers by setup, session and instrument instead of reading one blended total.
- Check expectancy monthly and against the break-even win rate for your average RR.
- Review the losing streaks: were they normal variance or rule breaks?
The LSG Club journal shows results in $, % or R with analytics, the equity curve and drawdown. Its optimal RR and optimal break-even replays run your actual trades over real candles to show which target and which break-even rule would have produced the best total, and a “what if” simulator lets you test a rule change on your history before adopting it. A weekly trading review is the natural place to look at these numbers, and the piece on trading psychology and journaling covers what to do when a streak tests your discipline. You can try it with sample data in the journal demo. To test your own numbers, the free risk-reward and expectancy calculator shows the break-even win rate for any R:R.
Win rate vs risk-reward FAQ
What is a good win rate in forex?
There is no universal good win rate. It is only good relative to your average RR: 40% is solid at an average 2R win and losing at 1R. Calculate your break-even win rate with 1 ÷ (1 + RR) and look at how far above it you are.
Can you be profitable with a 30% win rate?
Yes, mathematically, if your average win is comfortably above about 2.3R after costs. At 30% the break-even RR is 1:2.33, so a strategy averaging 3R wins would have positive expectancy. The practical challenge is enduring the long losing streaks that come with that hit rate.
Which matters more, win rate or risk-reward?
Neither in isolation. Expectancy, which combines both, decides profitability. Win rate matters more for psychology and drawdown depth, while risk-reward decides how many losses each win can pay for.
How many trades do I need to know my real win rate?
At least 30 trades for a rough idea and 50–100 per setup for a usable estimate. Even at 100 trades the margin of error is around ±10 percentage points, so look for consistency across months rather than a single number.