How to Do a Weekly Trading Review: The ICT Trader's Process
A step-by-step weekly review: replay every trade, read the right metrics, tag mistakes and choose one rule to improve next week.
A weekly trading review is a fixed, once-a-week session where you replay every trade, read a small set of metrics, tag the mistakes and choose one improvement for the next week. It is where daily journal entries turn into decisions, because patterns that are invisible in a single day become obvious across five. This is the step-by-step process we recommend in the LSG Club trader community, with the metrics to check and how the journal’s analytics support each step.
When to do a weekly trading review and how long it takes
Pick one slot and protect it: Friday after the close or Saturday morning works for most traders, while the week is fresh but the market is shut. Plan 45–90 minutes. Shorter usually means trades were skimmed; much longer usually means the review turned into re-analysis of the charts instead of an assessment of your decisions.
The review only works if the daily journal is complete. Every trade needs its entry, stop, target, result in R, Kill Zone, setup name and a chart. If the week is not logged yet, do that first, or import the MT4/MT5 report so nothing is missing. The ICT trading journal template lists the fields that make a review possible.
The weekly review process step by step
Run the same sequence every week so the results are comparable.
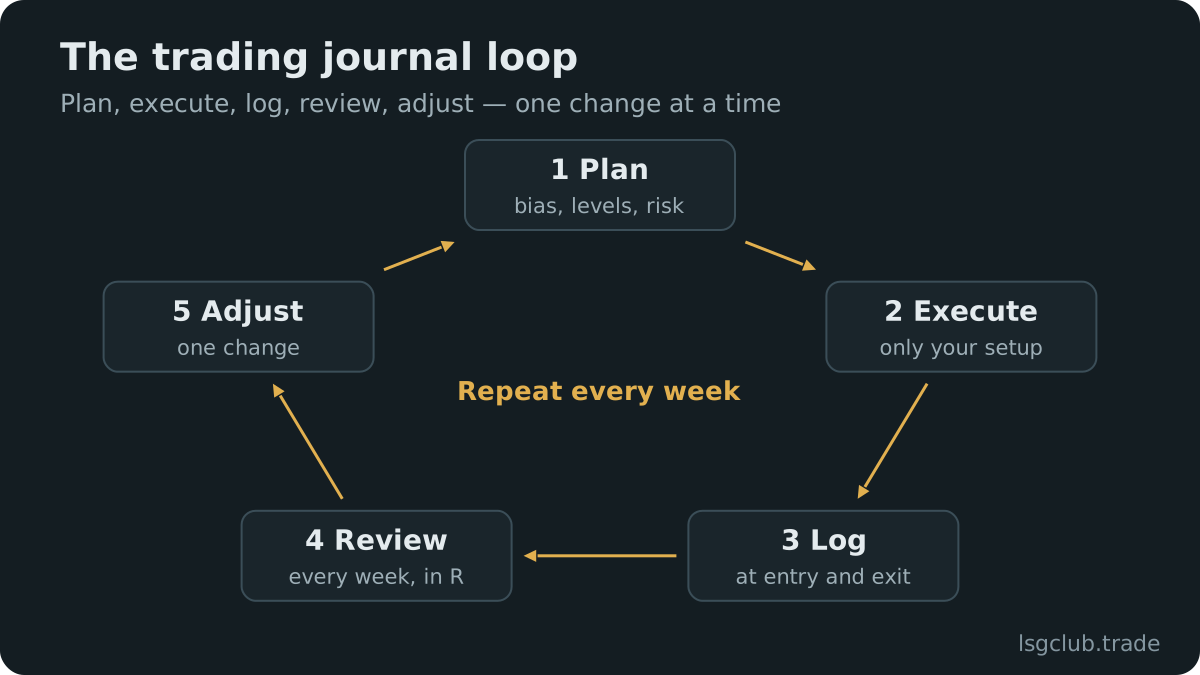
- Collect the week — confirm all trades and no-trade days are in the journal.
- Replay each trade on the chart against the plan you wrote before the session.
- Read the weekly metrics and compare them with the previous four weeks.
- Tag every mistake with one category.
- Pick one improvement and write it as a concrete rule for next week.
- Prepare the next week’s higher-timeframe picture and calendar.
Step 1: collect the week
Check the trade count against your broker statement. Missing losers are the most common reason a review looks better than reality. Include days you planned to trade but stayed flat, with a line on why: a filter that kept you out of a bad market is worth knowing about.
Step 2: replay each trade
Open each trade on the chart with its stop and target zones and answer three questions. Was it in the plan, meaning the bias, the Kill Zone and the setup you wrote down? Was it executed as planned: entry zone, stop placement, size? What happened after the exit: did price reach your target later, or would a nearer target have paid? Grade each trade A, B or C for execution quality, independent of whether it won.
Step 3: read the metrics
Look at numbers only after the replay, so the chart review is not biased by the P&L. The next section lists what to check.
Which metrics to check every week
One week is a small sample, so treat the numbers as signals to watch rather than verdicts. Compare with the last four weeks and with your long-run averages.
- Net result in R — the week’s total, independent of position size; also check it in $ or % against your drawdown limits.
- Number of trades — compared with your plan; a jump often signals overtrading.
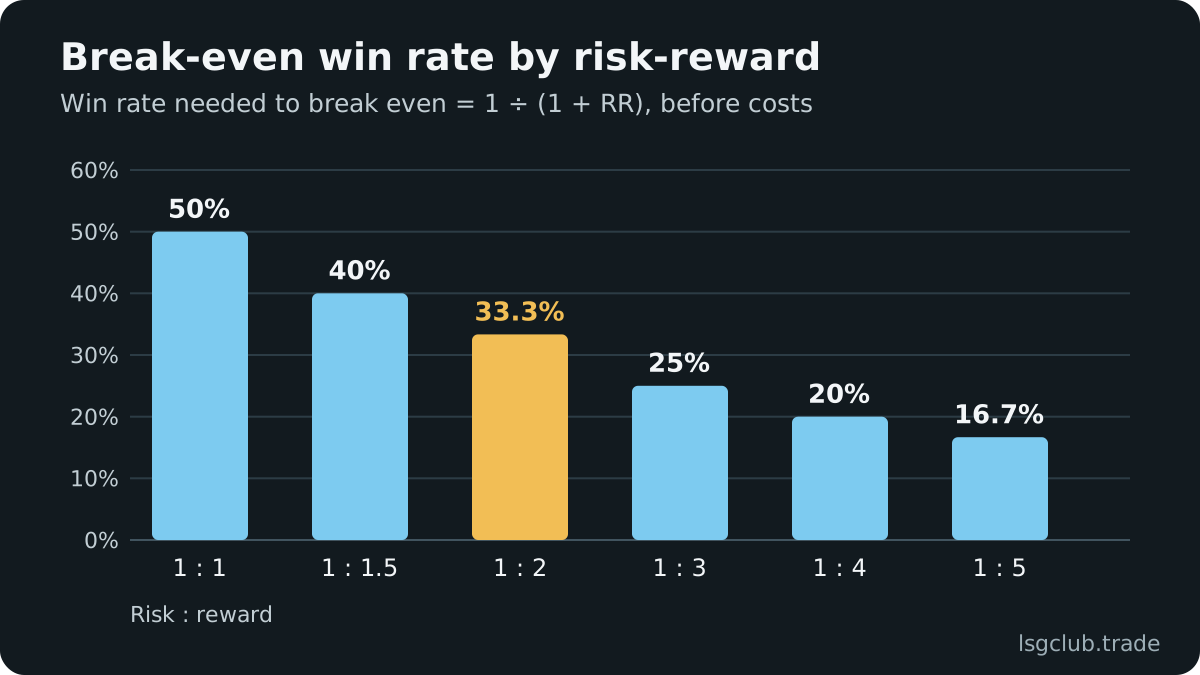
- Win rate and average win vs average loss in R — read together, as explained in win rate vs risk-reward.
- Rule adherence — the share of trades that followed the plan fully; often the most useful single number.
- Results by Kill Zone and by setup — which windows and models made or lost money.
- Actual loss per losing trade — any loss larger than 1R points to slippage, a moved stop or wrong sizing.
- Trades after a loss and the second or third trade of the day — common places where discipline slips.
- Holding time — whether winners are cut early or losers are held hoping for a return.
Tagging mistakes so they become patterns
A mistake that is only remembered is repeated; a mistake that is tagged becomes countable. Keep a short, fixed list of tags and give every flawed trade exactly one main tag. After a month, the counts show which mistake actually costs the most.
Analysis mistakes
The idea was wrong before the entry: trading against the daily bias, buying in premium, entering without a liquidity sweep, or ignoring a higher-timeframe level directly in the path. These are fixed in preparation, not in execution. The guide to mistakes ICT traders make lists the most frequent ones.
Execution mistakes
The idea was fine but the handling was not: chasing price instead of waiting for the return to the fair value gap, a stop placed inside the swing instead of beyond it, the wrong size, moving the stop, or closing early. These are fixed with checklists and fixed rules.
Behavioral mistakes
The decision came from state rather than the plan: revenge trades after a loss, trading outside the Kill Zone from boredom, FOMO entries, ignoring the daily loss limit. These are fixed with hard limits and by noticing the trigger. The article on trading psychology and journaling goes deeper on this category.
Deciding one improvement for next week
End the review with a single change. Several changes at once make it impossible to tell which one helped, and they rarely survive a busy week. Choose the tag that cost the most R this week or that has repeated across several weeks.
Write the change as an if–then rule you can check: “If I take a loss in the London Kill Zone, then I do not trade again until New York” is testable; “be more patient” is not. Put the rule at the top of next week’s trading plan and score it in the following review: followed or not, and what happened.
Example of a weekly review
The following is an illustrative example, not real results. A trader takes eight trades in the week: three wins at +2R, +2.5R and +1.8R, five losses: three at −1R and two at −1.5R because of a widened stop. Net result +0.3R. The replay shows that all three wins came in the London Kill Zone after a sweep of the Asian range, while four of the five losses were taken in New York after a London loss, two of them without a liquidity sweep. Tags: two execution mistakes (moved stop), three behavioral (trading after a loss outside the plan).
The improvement chosen: “If London produces a loss, I do not trade the New York session that day.” Next Friday the trader checks whether the rule was kept and how the week compared, and keeps it for at least a few weeks before judging it.
How the LSG Club journal supports the weekly review
Each step above maps to a part of the journal, which is free for every club member.
- Collecting the week — MT4/MT5 report import from HTML or CSV with duplicates skipped, plus a month calendar showing every trading day.
- Replaying trades — every trade on a real chart (M1–D1 candles) with its stop and target zones.
- Metrics — analytics, equity curve and drawdown, with results in $, % or R and breakdowns by session.
- Behavioral patterns — the behaviour report shows which sessions, holding times, trade-of-the-day numbers and after-a-loss trades cost money.
- Testing the improvement — optimal RR and optimal break-even replays on real candles, and a trade simulator for rules like a daily trade limit or a pause after a loss, or another take-profit.
- Next week’s plan — trading plans, checklists and a setup playbook, plus a weekly report from the Telegram bot @lsgclubbot.
If you trade a prop account, add the challenge tracker to the review so the week is judged against the daily and maximum loss as well. For how a regular review fits with daily journaling, see trading journal habits. You can try the analytics with sample data in the journal demo.
FAQ
How long should a weekly trading review take?
Usually 45–90 minutes for a trader taking up to around ten trades a week. Most of the time goes into replaying trades on the chart. If it regularly takes longer, simplify the metrics rather than skipping the replay.
What should I do in a weekly review if I had no trades?
Review the setups you passed on. Check whether the filters kept you out of bad trades or out of good ones, and whether your preparation matched what the market actually did. A no-trade week can be the most disciplined week of the month.
Should I change my strategy after a losing week?
Usually not. One week is far too small a sample to judge a strategy. Change execution and behavior based on tagged mistakes, and evaluate the strategy itself over 50–100 trades of the same setup.
What is the difference between a daily journal and a weekly review?
The daily journal records what happened while it is fresh. The weekly review looks across those entries to find patterns, measure them and decide on one change. You need both: without daily entries the review has nothing reliable to analyze.