10 Mistakes ICT Traders Make in Their First Year (And How to Fix Them)
Ten mistakes new ICT traders make, from trading every FVG to entering before the liquidity sweep, with a concrete fix for each and a pre-trade checklist.
Most first-year ICT mistakes are not about misunderstanding a concept. They come from applying a correct concept in the wrong place, at the wrong time, or without a rule that decides when it counts. Below are ten mistakes ICT traders make in their first year, what each looks like on a chart, and a concrete fix you can test over your next 30–50 trades in LSG Club’s free trading journal or your own records.
Setup mistakes ICT traders make: what, when and where to trade
The first five mistakes happen before the order is placed. Each one is a correct concept used without the filter that makes it count.
1. Trading every order block and fair value gap
After learning order blocks and FVGs, every chart looks full of them — and on a one-minute chart almost every impulse leaves one. Treating them all as entries produces a long series of small losses and the conclusion that the method does not work.
Fix: an array counts only when it passes three filters. It was created by displacement (a strong, fast move that broke structure), it points in the direction of your daily bias and draw on liquidity, and it sits in the right zone — discount for longs, premium for shorts. The FVG trading strategy guide applies these filters step by step. Tag every entry with the array you used; after a few weeks the journal shows which kind actually works for you.
2. Trading without a daily bias
Without a bias, a sweep of the lows is a long signal at one moment and a breakdown short an hour later. The trader takes both and loses on both.
Fix: write the bias before the session in two sentences: where the draw on liquidity is (for example, buy-side liquidity above last week’s high, or an unfilled daily FVG) and what would make the idea wrong. If the higher timeframe is unclear, the bias is “neutral — no trade”, and that is a valid decision. The ICT daily bias tutorial walks through the process. Record the bias and mark it right or wrong after the session; bias accuracy is a number you can improve.
3. Ignoring time, or mixing time zones
ICT setups are tied to time. The Kill Zones are when liquidity tends to be engaged and displacement tends to appear, so a setup in the middle of a quiet session can look identical and behave very differently. A quieter version of the same mistake is reading London as 02:00–05:00 in one place and 07:00–10:00 in another without noticing that one is New York time and the other is UTC in winter — and that the UTC hours move an hour earlier in summer.
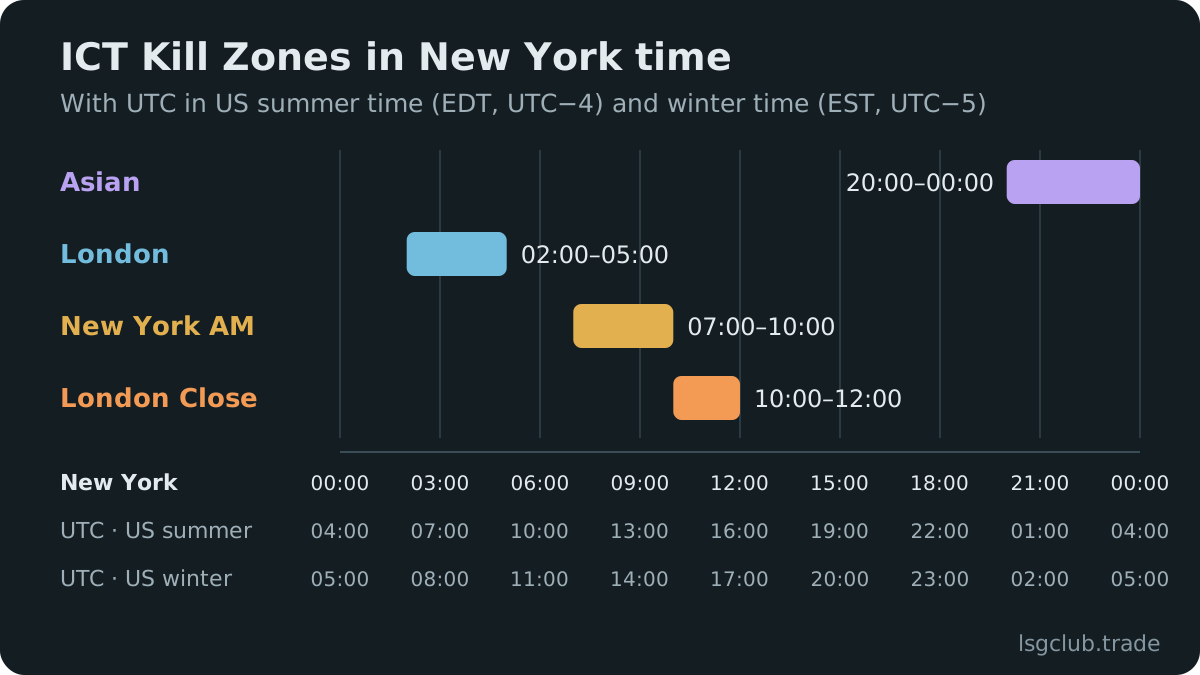
Fix: choose one convention and write it into your plan. ICT defines the London Kill Zone as 02:00–05:00 and the New York AM Kill Zone as 07:00–10:00 New York time; the LSG journal uses the same New York-time windows, so you never convert between the plan and the review. Tag every trade with its session and compare results. The Kill Zone trading guide covers each window.
4. Entering before liquidity is taken
The core ICT sequence is a raid on liquidity, then a market structure shift with displacement, then a return into the array left by that move. New traders often buy at the order block while sell-side liquidity still rests just below it — and then watch price sweep those lows and their stop together.
Fix: mark the obvious pools first — buy-side liquidity above equal or old highs, sell-side below equal or old lows. For a long, require that sell-side liquidity has been swept and that price has then shifted structure upward with displacement; reverse it for shorts. The liquidity sweep guide shows how to tell a sweep from a genuine breakout: a sweep takes the level and closes back inside, while a breakout is accepted beyond it.
5. Buying in premium and selling in discount
A bullish FVG near the top of a range is still near the top of the range. Buying there means a poor stop-to-target ratio and buying where larger participants are more likely to sell.
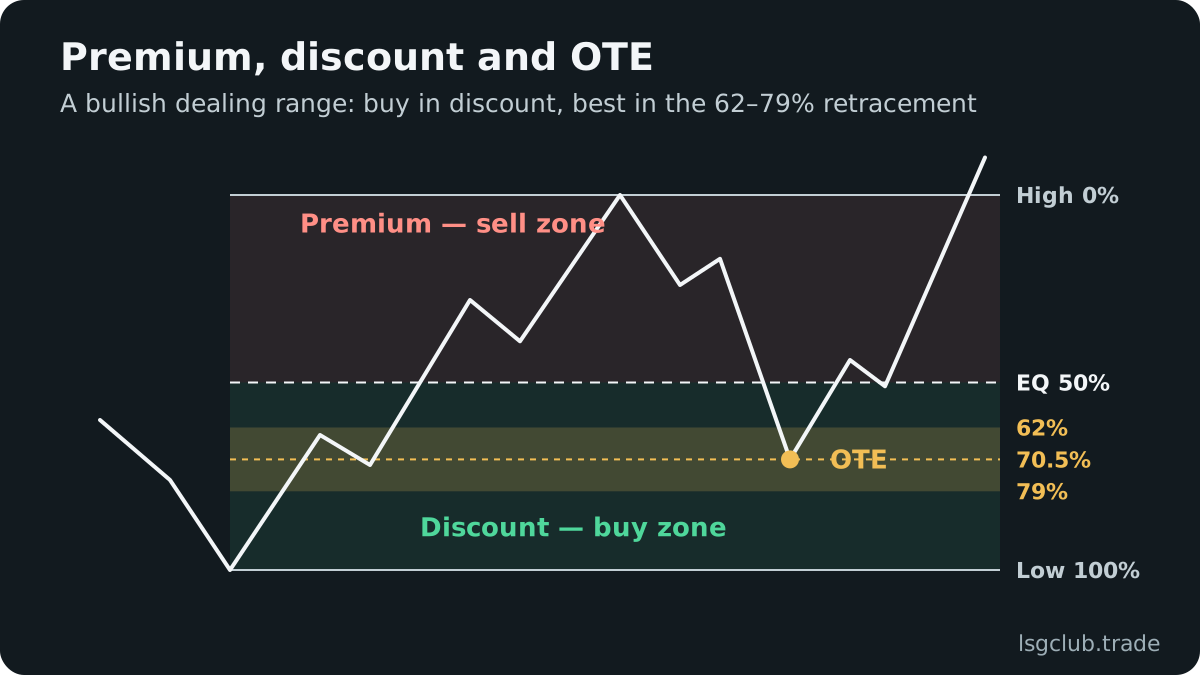
Fix: define the dealing range — the swing low and swing high that framed the move — and mark equilibrium at 50%. Look for longs only below it, in discount, and shorts only above it, in premium. For more precise entries, the OTE zone is the 62–79% retracement of the range, with 70.5% as its midpoint. Premium and discount in ICT explains how to choose the right range when timeframes disagree.
Trade management mistakes
A sound entry can still lose money through the stop, the size and the exit. These two mistakes turn good analysis into poor results.
6. Stops in the wrong place, and size that ignores the stop
Two versions of one mistake. Stops placed at a round number or “a bit below the candle” sit inside the next sweep. Stops moved wider as price approaches turn a planned 1R loss into 2R. Both damage results even when the analysis is right.
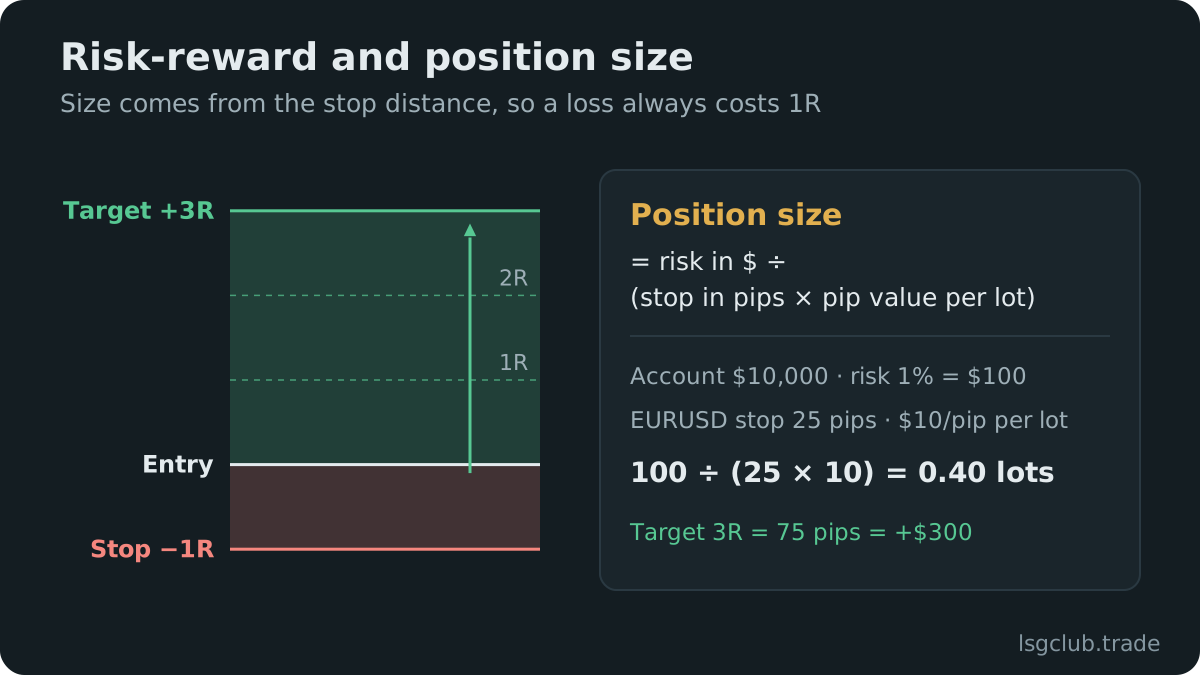
Fix: the stop goes where the idea is invalidated — beyond the swing that was swept, or beyond the order block — and the position size is calculated from that distance so the dollar risk stays fixed. Say the account is $10,000 and you risk 1% ($100): a 10-pip stop on EURUSD means 1 standard lot, a 25-pip stop means 0.4 lots, and both trades are the same 1R. The position size guide gives the formula for gold and indices too. In the journal, watch your average loss: if it is worse than -1R, stops are being moved.
7. Closing too early, or moving to break-even too soon
The analysis says the target is buy-side liquidity above yesterday’s high. The trade reaches +1R, pulls back, and the trader closes it or moves the stop to entry. The trade is stopped out at break-even and later runs to the original target without them. Repeated often enough, this can flatten the results of a setup that would otherwise have a positive expectancy.
Fix: set the target at a liquidity level before entry, and decide in advance when, if ever, the stop moves to break-even — for example, only after price forms a new structure point in your favor. Then measure the cost. The LSG journal replays your trades on real candles to show the optimal RR and the optimal break-even point for your own history, so you can see whether early exits protect you or cost you.
Discipline and process mistakes
The last three mistakes are about the trader rather than the chart: how losses are handled, how focus is kept and how a method is judged.
8. Overtrading after a loss
A loss in London is followed by a second trade that does not pass the checklist, then a third with a bigger size to win it back. This pattern rarely feels like a decision while it is happening, which is why it needs a rule rather than willpower.
Fix: write a rule that triggers on its own — for example, at most two trades per Kill Zone and a full stop after two losses in a row. Log a one-word state before each trade. After a month, filter the journal for trades taken within an hour after a loss; the LSG behaviour report groups after-loss trades for you. If they are negative, the rule pays for itself.
9. Too many instruments, models and timeframes
New ICT traders often watch eight pairs, gold and two indices, and rotate between Silver Bullet, Power of 3, turtle soup and breaker setups week by week. Each model gets ten trades and none gets a fair test.
Fix: choose one or two instruments and one model for at least a few months. Write that model into a setup playbook with exact conditions, and tag every trade with it. Each instrument has its own character — gold, for example, now moves large dollar amounts per day, so its range is better judged relative to its ATR or in percent than in fixed dollars — and you only learn that character by staying with it.
10. Judging the method on a handful of trades
Ten trades cannot tell an edge from a streak. Traders abandon a sound model after a run of losses, or scale up an unproven one after a run of wins. Both decisions come from too little data.
Fix: log every trade with the same fields — setup, session, bias, liquidity taken, entry array, result in R, checklist compliance — and review them on a fixed day each week:
- Check that every trade of the week has its setup, session, bias and result in R filled in.
- Mark the bias right or wrong for each session you traded.
- Group the results by setup and by session, and note how many trades each group holds.
- Separate the trades that broke the checklist and add up what they cost in R.
- Write down one change for next week, with the date, and leave everything else as it is.
Change a setup only after a meaningful sample, and judge it by expectancy in R, not by the last five trades. The ICT trading journal template gives a field list you can start with today, or you can join the club and log trades in the free LSG journal.
Turn the list into a pre-trade checklist
The ten fixes compress into a checklist you can read in under a minute before each entry:
- Bias — written before the session, with an invalidation level
- Time — inside the Kill Zone you planned, in one time convention
- Liquidity — the opposing pool has been swept
- Structure — a shift with displacement in the direction of the bias
- Location — discount for longs, premium for shorts
- Array — created by the displacement, not picked afterwards
- Stop and size — stop at invalidation, size calculated from it
- Target and management — target at liquidity, break-even rule decided
- State — outside your cool-down period after a loss
If any line fails, skip the trade and log it as skipped. Over time the skipped trades show whether the checklist filters out bad trades or good ones — information no single trade can give you. Trading carries real risk; a checklist reduces avoidable mistakes, it does not remove losses.
FAQ
Which of these mistakes should I fix first?
The one your own journal shows is costing the most R. If you do not have that data yet, start with the daily bias and with waiting for the liquidity sweep, because those two filters remove many of the trades where the other mistakes happen.
How many trades do I need before judging an ICT setup?
There is no exact number, but ten is far too few. Treat 30–50 trades under the same rules as a first test and a larger sample as stronger evidence. If you change the rules, start the count again.
Should I go back to a demo account while I fix these mistakes?
It is a reasonable step if the mistakes are costing real money, especially overtrading and moved stops. Another option is to keep trading live at the smallest size you can. Either way, log the trades exactly as you would with full risk, so the data stays comparable.
How can I tell which mistake is costing me money?
Tag each trade with the setup, the session, checklist compliance and your state before entry, then compare results in R by tag. A group with a clearly negative result over a meaningful sample shows where the leak is, and the tag tells you which fix to apply.