ICT Market Maker Model: AMD Accumulation, Manipulation, Distribution
The four phases of the ICT market maker model, the buy and sell versions, and how accumulation, manipulation and distribution fit inside it.
The ICT market maker model is a template for how price travels from one liquidity pool to another: it leaves a consolidation, runs liquidity on one side, reverses at a higher-timeframe level, and returns through the same prices toward the opposite side. Traders who log their trades in LSG Club’s free trading journal use it as a map for where a move is likely to start and end, not as a forecast. Below are the four phases as ICT teaches them, the buy and sell versions, and how the model lines up with accumulation, manipulation and distribution (AMD).
What the ICT market maker model describes
ICT presents the market maker model as a picture of delivery between two points. Price starts in a range, moves away from it in steps, builds liquidity on the way, then turns at a premium or discount array and retraces the whole journey. Drawn on a chart, it looks like a curve or a "V" with two sides: the side going into the reversal and the side coming out of it.
The model is fractal. ICT applies it to weekly and daily charts for swing trades and to H1 and M15 for intraday trades. What stays constant is the logic: liquidity built on the way in becomes the target on the way out.
The four phases of the market maker model
The phases below describe a market maker buy model. The sell model is the mirror image and is covered in the next section.
Original consolidation
Everything starts from a range where price balances for a while. Its high is the reference point for the whole model, because the buy-side liquidity above it is where the model is expected to end. Mark the range high and low before anything else; without a clear original consolidation, there is no model to trade.
Engineering liquidity on the sell side of the curve
Price leaves the range lower and declines in stages. Each leg down is followed by a small consolidation or pullback, and each of those creates new swing highs with buy stops above them and new lows that invite late sellers. ICT describes this phase as engineering liquidity: the decline builds the pools that the later rally will run through.
Smart money reversal
The decline ends when price reaches a higher-timeframe discount array — an order block, a fair value gap, an old low with sell-side liquidity below it. Price usually takes that sell-side liquidity, then turns with displacement and a market structure shift. This turning point is the smart money reversal and the low of the curve. See the overview of PD arrays for the levels ICT looks for here.
Distribution on the buy side of the curve
Price now climbs back through the levels it built on the way down, often in the same stepped rhythm, with short re-accumulation pauses. The highs left on the sell side of the curve are taken one by one. The objective is the buy-side liquidity above the original consolidation. When price reaches it, the model is complete and positions from the reversal are distributed into that liquidity.
Market maker buy model vs sell model
Market maker buy model (MMBM)
Original consolidation, a stepped decline into discount, a smart money reversal after a sell-side raid, then a rally back to and above the range high. Trade ideas come on the buy side of the curve: longs from fair value gaps or order blocks after the reversal, targeting the highs left during the decline.
Market maker sell model (MMSM)
Original consolidation, a stepped rally into premium that builds sell-side liquidity under each higher low, a smart money reversal after a buy-side raid, then a decline back to and below the range low. Short ideas come on the sell side of the curve, targeting the lows left during the rally.
One practical consequence: the first half of any model is the hardest part to trade. You do not know where the reversal will be until the higher-timeframe array is reached and structure shifts, so most ICT traders wait for the second half.
How AMD maps onto the market maker model
Accumulation, manipulation and distribution, also called the Power of 3, is ICT’s template for a single candle or session: a quiet open, a false move against the day’s direction, then the real expansion. The market maker model covers a larger stretch of price, but the same three ideas fit inside it.
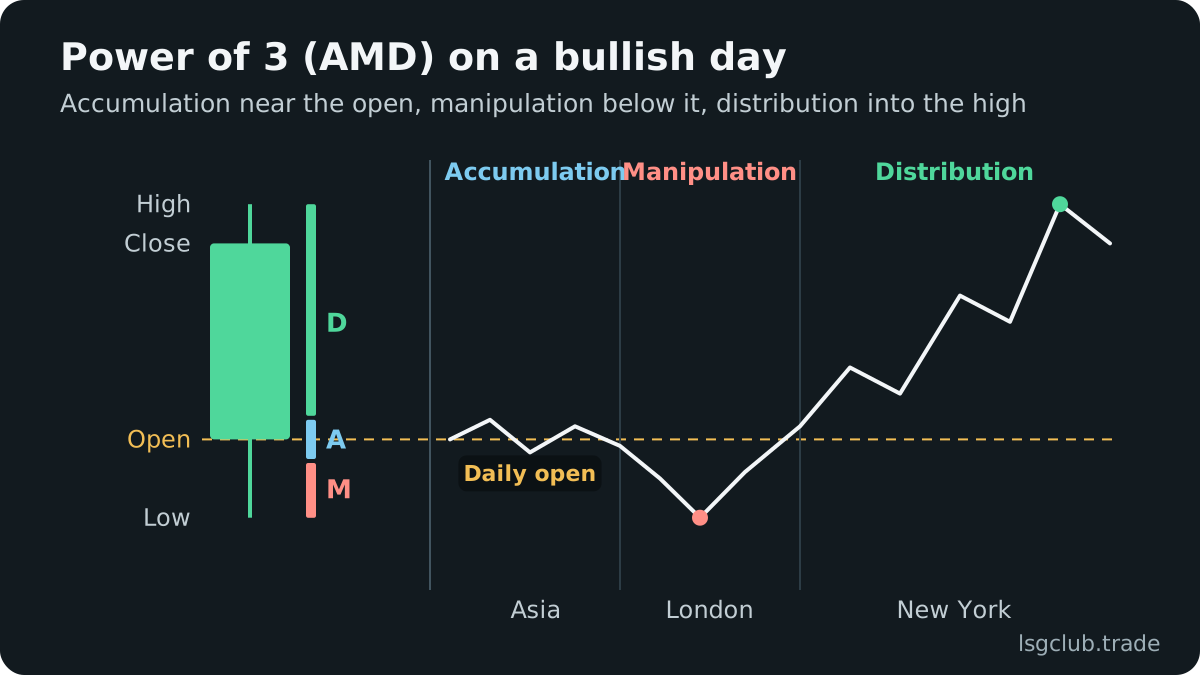
- Accumulation — the original consolidation, where positions are built quietly inside a range
- Manipulation — the run into the higher-timeframe array and the raid on liquidity that marks the smart money reversal
- Distribution — the buy side of the curve in an MMBM (sell side in an MMSM), where price delivers to the opposite liquidity
This is an interpretive mapping, not a rule. In the Power of 3, manipulation is a short Judas swing near the open. In the market maker model, the manipulation leg can run for days on a higher timeframe. Keep the timeframes separate in your notes so the two templates do not blur.
Framing a trade with the market maker model
- Identify the original consolidation on the higher timeframe and mark its high and low.
- Note the direction price left the range and mark each swing it leaves behind — these are future targets.
- Locate the higher-timeframe premium or discount array where a reversal would make sense.
- Wait for price to reach that array, take liquidity, and shift structure with displacement on a lower timeframe.
- Enter on the retracement into the fair value gap or order block created by the shift, with the stop beyond the reversal extreme.
- Take partials at the swing levels left on the first side of the curve, with the final target at the original consolidation.
Step 4 is where most of the risk is controlled. Without a confirmed market structure shift at the array, you are guessing the low of the curve, and the stepped decline can continue through your level.
Example: an intraday market maker buy model
This is a hypothetical example for illustration. On gold, the H1 chart shows a range during the Asian session — the original consolidation. In London, price falls out of it in three legs, each with a small pause and a lower high. The third leg reaches an H4 bullish fair value gap in discount and wicks below the previous day low.
On M15, price then breaks the last lower high with a large bullish candle. The trader buys the retracement into the M15 fair value gap, with the stop below the wick low and the stop distance sized from ATR. Partial targets are the lower highs left during the decline; the final target is the Asian range high. If price had closed back below the wick low, the reversal would have been invalid and the model would have been treated as still on the sell side. The guide to trading gold with ICT concepts covers how to adjust for its wider ranges.
Common mistakes with the model
- Forcing a curve onto every chart — no clear original consolidation means no model
- Buying the first leg down — calling the smart money reversal before price reaches a higher-timeframe array
- Ignoring timeframes — mixing a weekly model with an M5 entry without checking they agree
- Holding for the full target every time — the original consolidation is the ideal objective, not a promise
- Treating it as a prediction — the model frames probabilities; any trade built on it can lose
In your journal, tag each trade with the model phase you entered in and whether the reversal had a structure shift. Over time this shows whether your edge, if any, comes from the buy side of the curve or from early attempts to catch the turn.
FAQ
Is the market maker model the same as AMD?
Not exactly. AMD, or the Power of 3, describes how a single candle or session forms. The market maker model describes a full move between two liquidity pools, which can contain many sessions. The three AMD stages fit inside the model, which is why they are often taught together.
Which timeframe is best for the market maker model?
ICT applies it on every timeframe. A practical approach is to spot the model on H4 or H1 and execute on M15 or M5. The higher the timeframe of the model, the more room the trade needs and the longer it will take to play out.
How do you know where the smart money reversal will happen?
You do not know in advance. You pre-mark candidates: higher-timeframe order blocks, fair value gaps and old highs or lows in premium or discount. The reversal is only confirmed after price reaches one of them, takes liquidity and shifts structure.
Does the market maker model work on forex, gold and indices?
The model describes how price moves between liquidity pools, so ICT traders apply it to any liquid market. What changes between instruments is volatility and session timing. Test it on the instruments you trade and review the results before relying on it.