ICT Weekly Profile: How to Predict the Weekly High and Low
The weekly templates ICT describes, when Monday or Tuesday tends to form the weekly high or low, and a weekend routine for setting weekly bias.
The ICT weekly profile is a set of templates for how a trading week tends to unfold: where the weekly high or low is likely to form, which days carry the expansion, and when a reversal becomes likely. It cannot tell you the exact high and low in advance, but it helps you judge whether Monday’s move looks like the real direction or a setup for a reversal. Many traders keep a note of each week’s shape in a free ICT trading journal from LSG Club, and after a few months the templates stop being theory and become a checklist.
What the ICT weekly profile is
Each week prints one candle on the weekly chart, and like any candle it has an open, a high, a low and a close. ICT applies the Power of 3 to that candle: a quiet open, a move against the week’s eventual direction, then the expansion. In a bullish week the low tends to form early and the high late; in a bearish week the opposite.
The weekly profile is the day-by-day version of that idea. It asks which day is likely to form the low of a bullish week (or the high of a bearish one), and how the remaining days are likely to behave. ICT stresses that a profile only makes sense once you know the weekly direction — the profile describes the path, not the destination.
The weekly profiles ICT describes
ICT has taught several weekly templates. The descriptions below are bullish; for a bearish week swap highs for lows.
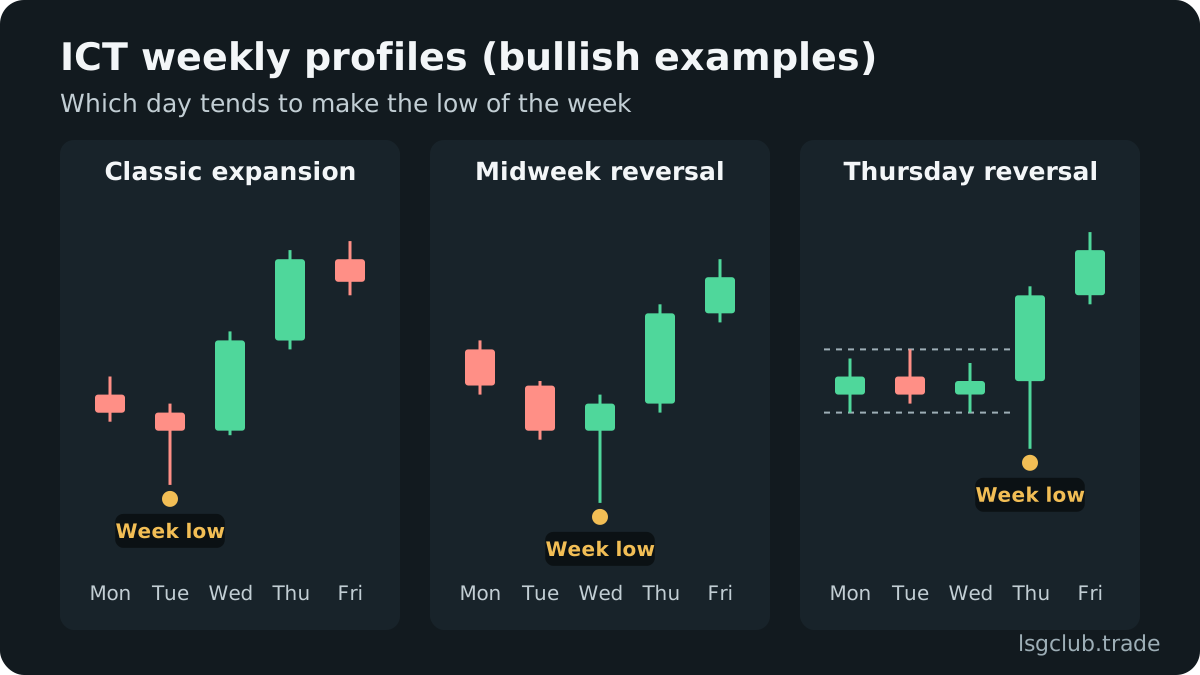
Classic expansion week
Monday or Tuesday dips into a higher-timeframe discount level and forms the low of the week, often by running sell-side liquidity below the previous week’s low or Monday’s low. Wednesday and Thursday expand higher toward the weekly draw on liquidity. Friday often consolidates or retraces part of the move. This is the template ICT tends to treat as the baseline.
Midweek reversal
Monday and Tuesday move against the weekly bias, sometimes convincingly enough to look like a new trend. Wednesday reaches a higher-timeframe array, raids liquidity and reverses. The low of the week forms midweek, and Thursday and Friday carry the expansion. Traders who committed to Monday’s direction get caught on the wrong side.
Consolidation and Thursday reversal
Price ranges from Monday to Wednesday without a clear expansion, building liquidity on both sides of the range. On Thursday, often around a high-impact news release, price runs one side of the consolidation and then reverses hard toward the other side and beyond. The weekly low or high is printed late, which makes this the hardest template to trade early.
Seek and destroy weeks
Some weeks have no clean profile. Price runs highs, then lows, then highs again, without a sustained expansion. ICT’s advice for these weeks is simple: recognize them and reduce activity or stay out. Choppy weeks often come around holidays or ahead of major scheduled events.
The Monday and Tuesday high or low idea, with caveats
The best-known part of the weekly profile is the idea that, in a trending week, the low (bullish) or high (bearish) of the week often forms on Monday or Tuesday, frequently during the London session. It is a useful starting assumption, but it needs the right context, and it fails often enough that it should never be traded alone.
- It assumes a trending week — in a consolidation or midweek reversal week, the early extreme is the wrong side
- It needs a higher-timeframe level — an early low means more when it sits in a weekly or daily discount array
- It needs a liquidity raid — a Monday or Tuesday low that took out an obvious pool is stronger than one that formed in mid-air
- News moves the template — a heavy Wednesday or Thursday calendar can shift the turn later in the week
- Your own data decides — count how often it held on the instruments you trade before you lean on it
Building a weekly bias before Monday
The profile only works once you have a weekly bias. A short weekend routine is enough:
- On the weekly and daily chart, find the draw on liquidity: the old high or low, or the large fair value gap price is most likely to reach next.
- Mark the previous week’s high and low — the first pools the new week is likely to interact with.
- Check whether price sits in premium or discount of the current weekly dealing range.
- Look at the economic calendar and note which days carry high-impact releases.
- Write down a primary profile and one alternative, plus the price that would invalidate the bias.
If the dealing range and the draw are unclear, see the article on premium and discount for how to measure them. The same routine, scaled down to one day, is described in the daily bias tutorial.
Reading the weekly profile as the week unfolds
Monday and Tuesday
Watch how price treats the previous week’s levels and Monday’s range. A raid on sell-side liquidity into a discount level, followed by a market structure shift during the London or New York Kill Zone, fits a classic expansion week. A move straight away from your levels with no raid keeps the midweek and Thursday templates on the table.
Wednesday
If the early-week low held and price expands, the classic profile is in play and Wednesday entries trade with it. If Monday and Tuesday moved against the bias, Wednesday is where a midweek reversal would appear: a raid of the early-week extreme into a higher-timeframe array, then displacement back in the bias direction.
Thursday and Friday
Thursday either continues the expansion or, after a range week, delivers the reversal. By Friday the weekly range is usually largely set, and ICT often warns about a Friday retracement against the week’s move. Many traders take profits into Thursday’s expansion and trade Friday lightly or not at all.
Example: a midweek reversal week
This is a hypothetical example for illustration. EURUSD has a bullish weekly bias, with the previous month’s high as the draw. On Monday and Tuesday price falls steadily, breaking below the previous week’s low. A trader who expected a Monday low has already been stopped out twice.
On Wednesday in London, price trades into a daily bullish fair value gap, sweeps the Tuesday low, and shifts structure higher on M15. The trader buys the retracement into the new M15 gap with the stop below the Wednesday low, targeting the previous week’s high. The lesson recorded in the journal is not the profit or loss but the read: two failed early-week longs were a sign the week might be a midweek reversal, not a reason to keep buying.
Tracking weekly profiles in your journal
At the end of each week, label which template it was, which day formed the low and the high, and whether your Sunday forecast was right. Note the news days alongside. After a quarter you will know which profiles show up most on your instruments and which ones you misread. The weekly trade review process is the natural place to do this.
FAQ
Does the weekly low always form on Monday or Tuesday?
No. That idea describes a classic expansion week only. In a midweek reversal the low forms on Wednesday, and in a consolidation week it can form on Thursday. Treat the early-week extreme as a hypothesis that price has to confirm.
Which ICT weekly profile is the most common?
ICT presents the classic expansion week as the baseline template, but frequency depends on the instrument and the period. The honest answer is to count it yourself: label every week for three months and look at your own tally before building rules around it.
Can the weekly profile be used for day trading?
Yes, as a filter. The weekly profile tells you which direction and which days deserve your attention, and intraday setups in the Kill Zones provide the entries. A long on Monday that fits a classic expansion week is a better trade than the same long during a week that looks like a consolidation.
How do news releases affect the weekly profile?
High-impact releases often trigger the raid or the reversal in a profile. A heavy Wednesday or Thursday calendar makes a midweek or Thursday reversal more plausible, which is why the calendar belongs in the weekend routine. Stay flat through the release itself if your plan does not cover news volatility.