ICT Concepts: Complete Reference List for Traders (A–Z)
Every core ICT concept with a short definition and how to spot it, grouped by liquidity, structure, PD arrays, time and trading models.
This is a complete reference list of ICT concepts: every core term of the Inner Circle Trader method with a short, practical definition and a note on how to spot it on the chart. The terms are grouped by theme — liquidity, market structure, PD arrays, time and trading models — and listed A–Z inside each group, so you can find a word fast and see what it connects to. Keep it open next to LSG Club’s free trading journal while you review trades.
How to use this ICT concepts reference
ICT vocabulary is large because the method describes one process from several angles: where resting orders sit, how price confirms a change of direction, where it is likely to react, when it tends to move and how that combines into a repeatable trade.
Read one group at a time and find each concept on a past chart before moving on. SMC terms are included too, because SMC traders use the same ideas under slightly different names.
Liquidity concepts
Liquidity is the starting point of every ICT idea: price moves from one pool of resting orders to the next, so the first question on any chart is where those pools are.
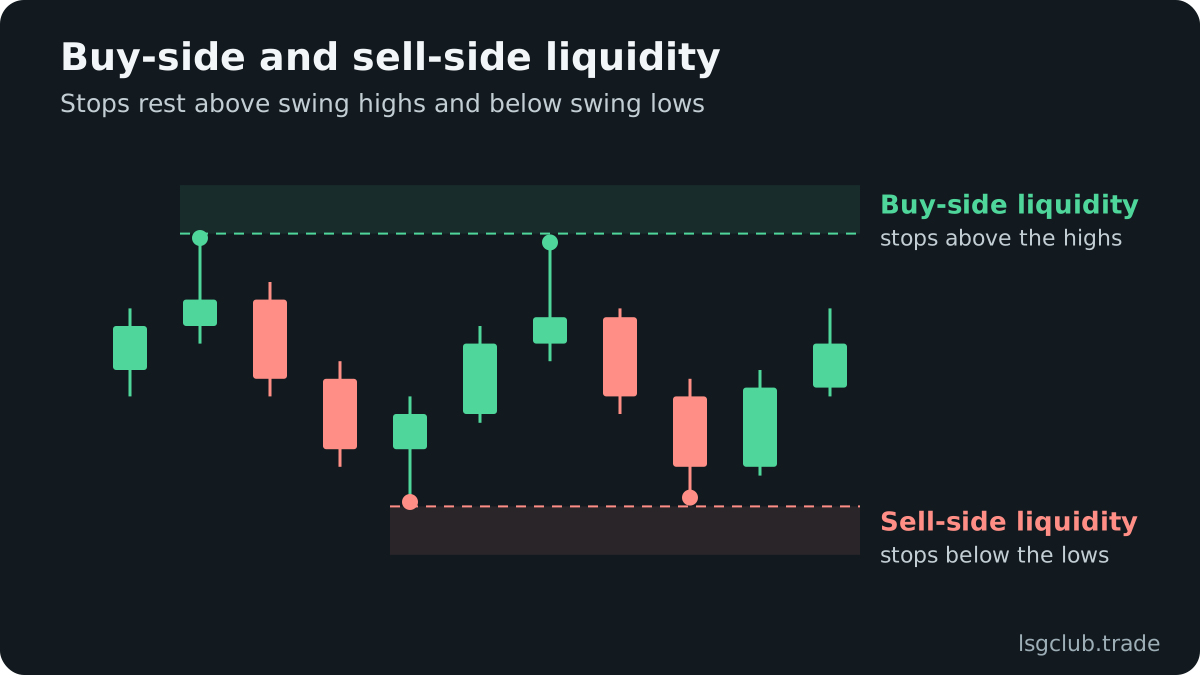
- Buy-side liquidity (BSL) — resting buy orders above swing highs and equal highs: stops of short sellers and breakout buy orders.
- Draw on liquidity — the pool price is most likely heading to next, such as an old daily high or an unfilled gap. It sets the target and the direction of your bias.
- Equal highs and equal lows — two or more swing points at nearly the same price. Textbook-clean levels attract stops and are a frequent sweep target.
- Inducement — a minor, obvious liquidity pool that invites early entries before price reaches the real level. In SMC it is often abbreviated IDM.
- Liquidity sweep (raid, stop hunt) — price trades through a high or low, takes the stops resting there and returns back inside the range. A sweep alone is not an entry signal.
- Sell-side liquidity (SSL) — resting sell orders below swing lows and equal lows: stops of buyers and breakout sell orders.
- Turtle soup — ICT’s name for a quickly rejected false breakout of a prior high or low, traded as a reversal.
The practical difference between a sweep and a real breakout is what happens after the level is taken. The full checklist is in the guide on the ICT liquidity sweep and how to trade it.
Market structure concepts
Structure tells you whether the side in control is still in control, read through swing points and the strength of the candles that break them.
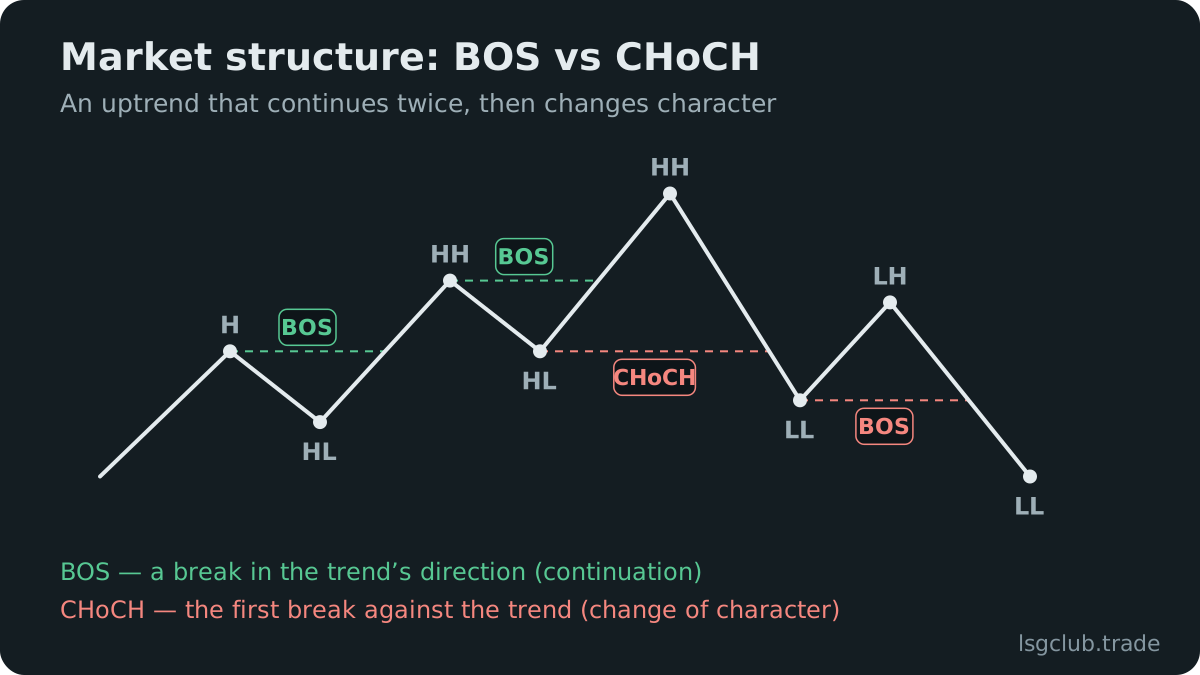
- Break of structure (BOS) — price closes beyond the last swing high in an uptrend or the last swing low in a downtrend. It confirms continuation.
- Change of character (CHoCH) — the first break against the prevailing swing sequence, the SMC name for an early sign of reversal.
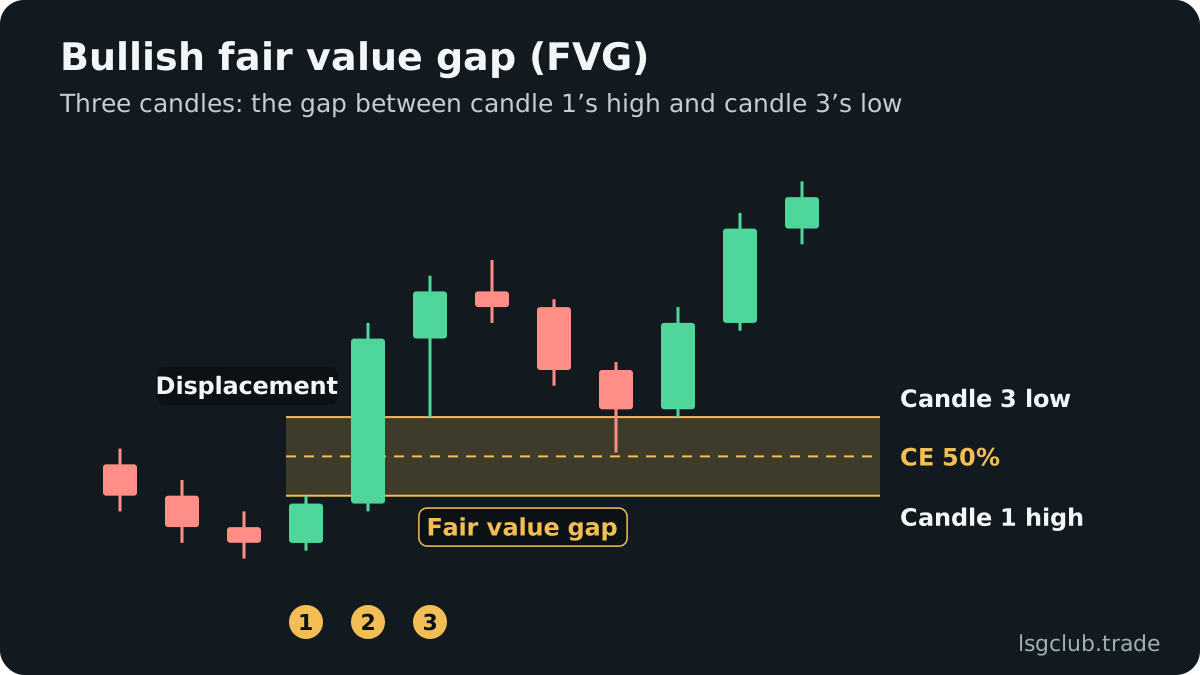
- Displacement — a fast, large-bodied move that clearly outpaces the surrounding candles. It usually leaves a fair value gap behind and is what makes a break trustworthy.
- Market structure shift (MSS) — ICT’s reversal confirmation: after a liquidity sweep, price breaks a recent short-term swing with displacement.
- Swing high and swing low — a candle with a higher high (or lower low) than its neighbors on each side; ICT grades them short-, intermediate- and long-term.
MSS and CHoCH describe almost the same event; the difference is mostly vocabulary and how strictly displacement is required. Both are compared in CHoCH vs BOS for reading smart money structure, and the entry rules are in the guide to the ICT market structure shift.
PD arrays: where price is expected to react
PD arrays (premium and discount arrays) are ICT’s collective name for the zones where price tends to react. The rule behind them is simple: look for buys in discount and sells in premium.
Premium, discount and equilibrium
- Dealing range — the range between a clear swing low and swing high that you are trading inside, for example the last H4 leg.
- Discount — the lower half of the dealing range, below equilibrium. Preferred area for long entries.
- Equilibrium — the 50% level of the dealing range. It splits premium from discount and is often a first reaction point.
- Optimal trade entry (OTE) — the 62–79% retracement of a swing, with 70.5% as its midpoint. It sits deep inside discount (for longs) or premium (for shorts).
- Premium — the upper half of the dealing range, above equilibrium. Preferred area for short entries.
Gaps and blocks
- Balanced price range (BPR) — the overlap of a bullish and a bearish fair value gap at the same price; the overlapping part is treated as the reaction zone.
- Breaker block — an order block that failed: price broke through it after a sweep, and the zone is then used from the other side.
- Fair value gap (FVG) — a three-candle pattern where the wicks of candles one and three do not overlap, leaving a gap in candle two’s body. Price often returns to it.
- Inversion fair value gap — an FVG that price closes through; it can then act as support or resistance in the opposite direction.
- Mitigation block — similar to a breaker, but formed when price failed to make a new high or low before breaking; there was no sweep.
- Order block (OB) — the last opposing candle before a displacement that breaks structure. The body range, often refined to its 50% level, is the entry zone.
Gaps and blocks work best when they sit in the right half of the range. See how to trade fair value gaps step by step and the order block entry rules for the full criteria.
Time-based ICT concepts
ICT treats time as seriously as price: the same pattern means less outside the windows when the main sessions deliver their moves.
Kill Zones and session windows
- Asian Kill Zone — 20:00–00:00 New York time. Usually builds the range that London later raids.
- London Kill Zone — 02:00–05:00 New York time. Often sets the high or low of the day.
- New York AM Kill Zone — 07:00–10:00 New York time, overlapping the US data releases and the stock market open.
- Silver Bullet — one-hour windows at 03:00–04:00, 10:00–11:00 and 14:00–15:00 New York time, used to trade an FVG after displacement.
ICT defines these windows in New York time, and the LSG journal tags trades with the same New York-time windows. In UTC they move with US daylight saving: Asia 00:00–04:00, London 06:00–09:00, New York 11:00–14:00 UTC in summer, one hour later in winter. Pick one clock for your notes.
Daily and weekly reference points
- Asian range — the high and low of the Asian session; the first liquidity London tends to target.
- Midnight open — the New York midnight opening price, used as a reference for whether price trades in premium or discount for the day.
- Previous day high and low (PDH/PDL) — the most watched intraday liquidity levels.
- Weekly profile — typical shapes of how the week’s high and low form, for example a bullish week that makes its low early and expands later.
ICT trading models and frameworks
Models turn single concepts into a plan by answering three questions: which way, where and when.
Power of 3 and the Judas swing
Power of 3 splits a candle, a session or a day into accumulation, manipulation and distribution (AMD). Price ranges, then makes a false move against the real direction — the Judas swing — and then expands toward the draw on liquidity. The whole cycle is explained in the ICT Power of 3 trading strategy guide.
Daily bias and the market maker model
- Daily bias — your expectation of whether today’s candle is more likely to be bullish or bearish, based on the higher-timeframe draw on liquidity.
- Market maker buy and sell models — a larger-scale map of price leaving a consolidation, reversing at a key level and returning.
- SMT divergence — two correlated markets disagree: one makes a new high or low, the other does not. ICT uses it to confirm a sweep, for example EURUSD against GBPUSD.
- Top-down analysis — reading the chart from monthly or weekly down to the entry timeframe so every entry is taken in the context above it.
How the concepts fit together in one trade
Example (illustrative, not a recommendation): a bullish day on EURUSD read with the terms above.
- Daily bias is bullish: the draw on liquidity is an old high above, and price trades in discount of the H4 dealing range.
- During the London Kill Zone, price runs the Asian low — a sell-side sweep and a likely Judas swing.
- On M5 a strong up-candle breaks the last short-term swing high: displacement and a market structure shift.
- The move leaves a fair value gap inside the OTE zone of the new leg; a limit order goes into that gap.
- The stop sits below the sweep low, the target is the buy-side liquidity above, and the trade is logged with its Kill Zone and setup tag.
If a step is missing — no sweep, no displacement, a gap in premium — grade the setup lower in your journal. You can see how a tagged trade looks on a real chart in the LSG journal demo.
Newer guides for concepts in this list: CHoCH, CISD, SMT divergence, SIBI and BISI, inverse FVG, rejection block, Judas swing and forex session times.
FAQ
What are the most important ICT concepts to learn first?
Start with liquidity (buy-side and sell-side), swing structure with BOS and MSS, fair value gaps and premium versus discount. Those four explain most ICT setups. Add Kill Zones next, then order blocks and the models.
Are ICT concepts and SMC concepts the same thing?
Largely, yes. SMC grew out of ICT teaching and uses the same ideas with some different names, such as CHoCH for an early reversal and IDM for inducement. Definitions vary between SMC educators.
What is a PD array in ICT?
A PD array is any zone where price is expected to react: fair value gaps, order blocks, breakers, mitigation blocks, old highs and lows. ICT uses discount arrays for long entries and premium arrays for short entries.
Do ICT concepts work on every market and timeframe?
Traders apply them to forex, indices, gold and crypto on many timeframes; they read cleaner on liquid instruments during active sessions. No concept guarantees a reaction, and every setup can fail, so risk per trade matters more than the label.