What Is BOS in Trading? Break of Structure Explained
What a break of structure is, which swings it breaks, body close vs wick, internal vs swing BOS, how it differs from CHoCH, MSS and CISD, and a worked EURUSD example.
BOS in trading stands for Break of Structure: a candle closes beyond the last swing high in an uptrend, or beyond the last swing low in a downtrend, and confirms that the side in control is still in control. It is the simplest event in ICT and Smart Money Concepts market structure. This guide from LSG Club, a club for ICT and SMC traders, explains which swings a BOS breaks, why the close matters more than the wick, how it differs from CHoCH, MSS and CISD, and how to turn it into an entry plan.
What is BOS in trading?
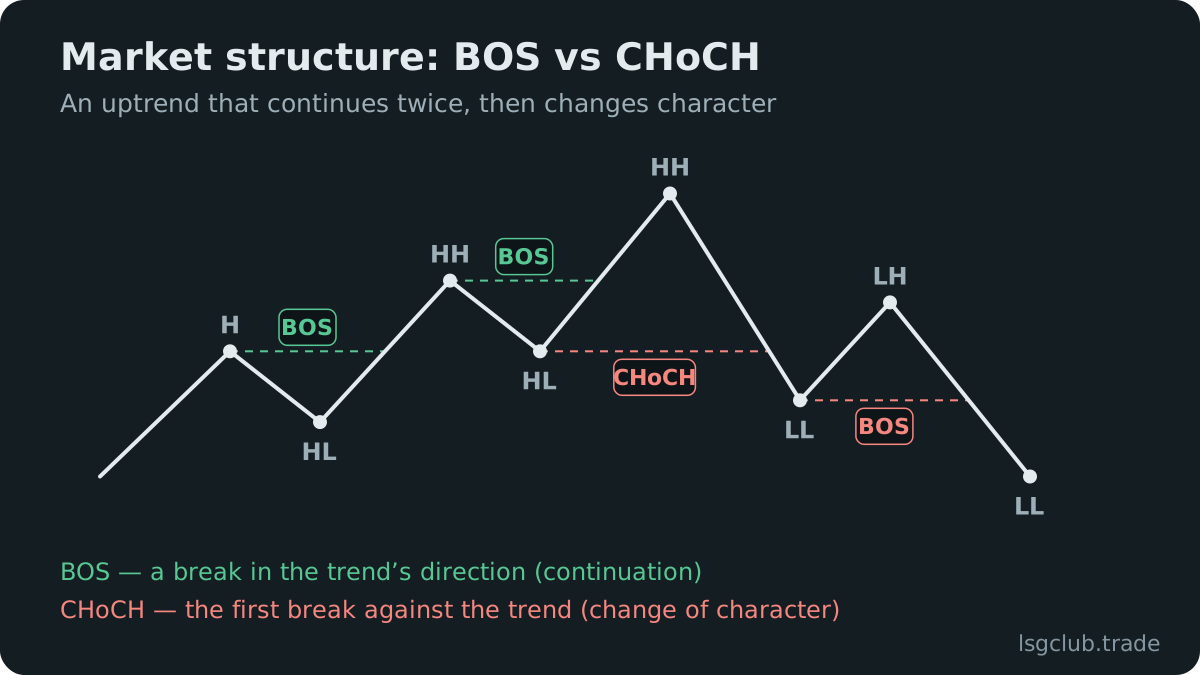
A trend is a sequence of swings. A bullish market makes higher highs and higher lows; a bearish market makes lower lows and lower highs. Each time price closes beyond the most recent extreme in the direction of the trend, it prints a break of structure.
A BOS answers one question: is the dominant side still pushing? It is not a signal to buy or sell at that moment. It tells you which way your next setup should point and creates a new swing that the trend now has to defend.
Bullish and bearish BOS
- Bullish BOS — in an uptrend, a candle body closes above the previous higher high. The higher low that launched the move becomes the protected low.
- Bearish BOS — in a downtrend, a candle body closes below the previous lower low. The lower high that launched the move becomes the protected high.
- What follows — after either one, the market usually pulls back before the next leg. Buying or selling the break candle itself often means taking the worst price of the move.
Which swing points a BOS breaks
A BOS is only as good as the swing it breaks. A swing high is a candle with a lower high on each side of it; a swing low is a candle with a higher low on each side. On lower timeframes that rule produces too many points, so traders add a condition: a swing counts only once price has moved away far enough to form the next swing in the opposite direction.
For a BOS you need two lines: the latest extreme the trend has to break next, and the protected swing behind it. A close through the first is a BOS. A close through the second puts the trend in question.
Body close vs wick: what confirms a break of structure
The most common argument about BOS is whether a wick through the level counts. The stricter convention, and the one most ICT and SMC traders use for entries, requires a candle body to close beyond the swing. A wick that pierces a high and closes back below it has taken the buy stops resting there and failed to hold. That is a liquidity sweep, and a sweep often comes before a move the other way, which is the opposite of what a BOS implies. The liquidity sweep guide shows how to tell a raid that reverses from a break that continues.
The breaking candle matters too. A large body with little overlap and a fair value gap behind it is displacement: one side is executing in size. A slow drift of small candles that barely closes beyond the level is fragile and fails more often. Whichever rule you choose, write it into your trading plan and apply it every time.
Internal BOS vs swing BOS
Every swing leg contains smaller legs, so the same chart carries two layers of structure. Swing structure is made of the major highs and lows on the timeframe you read the trend from, for example H4. Internal structure is the smaller sequence inside one swing leg, usually visible on M15 or M5.
- A swing BOS confirms the trend you trade with and moves the protected swing.
- An internal BOS happens inside a pullback or an impulse. During a bullish swing pullback, internal structure is bearish and prints bearish internal breaks until the pullback ends.
- An internal BOS back in the swing direction, after a pullback, is often the trigger traders wait for: the pullback is over and the swing trend is resuming.
- An internal BOS against swing structure is usually the pullback doing its job, not a reversal.
BOS vs CHoCH vs MSS vs CISD
These four terms describe breaks of different things. Use them precisely and your journal tags stay meaningful.
Break of Structure (BOS)
A close beyond the latest extreme in the direction of the trend. It signals continuation, and a healthy trend prints many of them in a row.
Change of Character (CHoCH)
The first close beyond the protected swing against the trend: below the last higher low in an uptrend, above the last lower high in a downtrend. It warns that control may be changing hands but does not prove a reversal; without a BOS in the new direction it is often just a deep pullback. The CHoCH vs BOS comparison walks through swing marking, timeframes and a full CHoCH example.
Market Structure Shift (MSS)
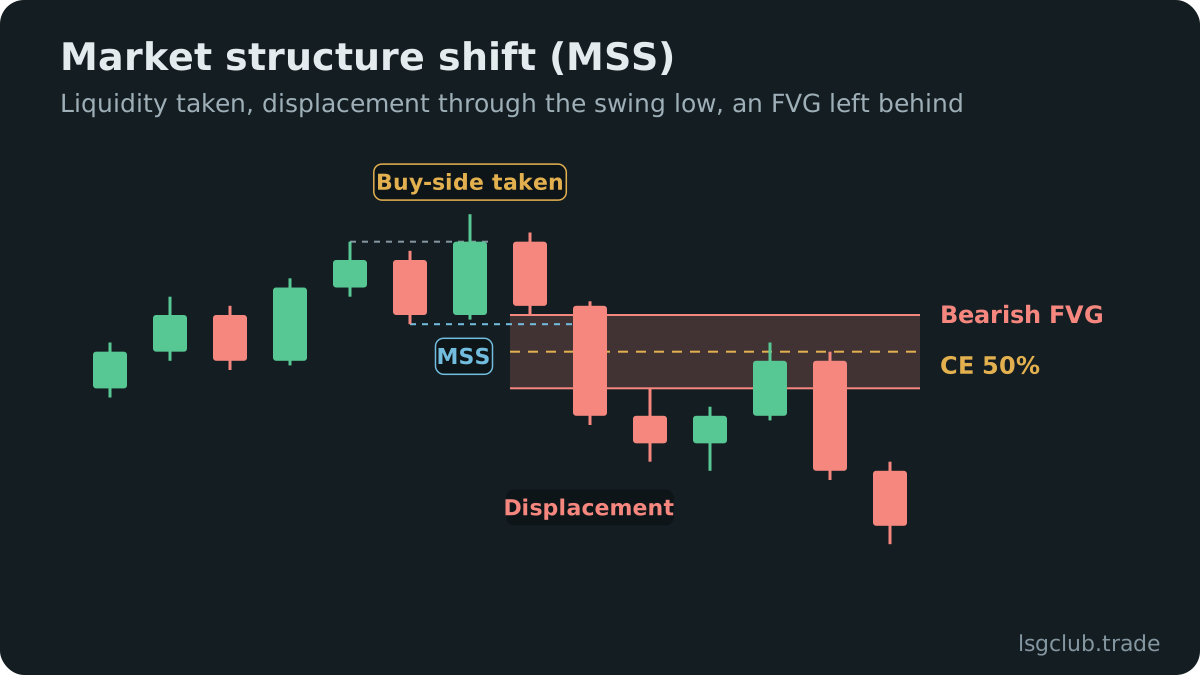
ICT’s term for a counter-trend break with context. Price first sweeps liquidity beyond an obvious high or low, then breaks the short-term swing behind the sweep with displacement and leaves a fair value gap. It is narrower than a CHoCH and works as an entry trigger, covered step by step in the ICT market structure shift guide.
Change in State of Delivery (CISD)
CISD comes from ICT’s later teaching and does not need a swing to break at all. After a run of down-close candles into a low, a body close back above the opening price of that run marks a change in the state of delivery from bearish to bullish; the reverse applies at a high. CISD prints earlier than a BOS or an MSS and is less reliable for the same reason, so CISD vs BOS is a trade-off between a better price and more confirmation.
How ICT and SMC traders use a BOS for entries
A BOS is context, not an entry. Whether you call it ICT or SMC, the usual way to turn one into a trade follows the same steps:
- Read swing structure on the higher timeframe, D1 or H4, and note the direction of the last swing BOS.
- Wait for the pullback after the break. In a bullish trend you want price back in the lower half of the leg that made the BOS, the discount zone.
- Mark the entry zone the break left behind: a fair value gap in the displacement leg, or the last opposing candle before it, the order block.
- Drop to a lower timeframe and wait for an internal BOS back in the swing direction from that zone.
- Place the stop beyond the low (or high) of the pullback and size the position from that stop, so a loss costs exactly 1R.
- Target the next obvious liquidity: the high the next BOS would have to take, or an older high beyond it.
Entering from the gap is covered in the fair value gap trading strategy, and choosing a target the market can actually reach is in risk-reward in ICT trading.
Worked example: a bullish BOS on EURUSD
Example for illustration only. EURUSD on H4 has made higher highs and higher lows for a week. The last higher high is 1.0895; after it, price pulled back to 1.0862.
During the London session price rallies from that 1.0862 low to 1.0921, and the H4 candle closes at 1.0914, a body close 19 pips above 1.0895. That is a bullish swing BOS. The leg leaves a fair value gap between 1.0878 and 1.0886, and the low it started from, 1.0862, becomes the new protected low.
Nobody buys at 1.0914. The plan is to wait for a pullback into the gap, below the 50% level of the leg at about 1.0891. The next morning price trades down to 1.0879, and an M15 candle body closes above the pullback’s last lower high at 1.0889: the internal BOS back in the H4 direction. Entry 1.0889, stop 1.0874 under the pullback low and the gap (15 pips), target 1.0919 just under the 1.0921 high where buy stops rest (30 pips, 2R). With 1% risk on a $10,000 account, $100 over a 15-pip stop at $10 a pip per lot gives 0.66 lots.
Invalidation is set in advance: an H4 body close below 1.0862 would be a CHoCH, and the stop at 1.0874 would already have closed the trade.
Common BOS mistakes
- Counting wicks as breaks — every liquidity sweep then looks like continuation, and you buy the top of a raid.
- Marking every minor high — on M1 a “BOS” appears every few minutes and stops meaning anything.
- Ignoring the higher timeframe — a bullish M5 BOS inside an H4 downtrend is usually a pullback in the bigger move.
- Moving the protected swing too early — it moves only when a new BOS confirms; until then the old swing decides whether the trend is intact.
How to track BOS setups in a journal
Tag every structure trade with the break behind it: internal or swing BOS, the timeframe, displacement or not, and the entry zone. After a few dozen trades, compare the tags in R and keep the variant that pays. An ICT trading journal that keeps each trade on a real chart makes that review much faster.
Frequently asked questions
What does BOS mean in trading?
BOS means Break of Structure: a candle closes beyond the latest swing high in an uptrend or the latest swing low in a downtrend. It confirms that the trend is continuing.
What is the difference between BOS and CHoCH?
A BOS breaks structure in the direction of the trend and signals continuation. A CHoCH is the first break against the trend, through the protected swing, and signals that control may be changing. A trend prints many BOS and only one CHoCH at the turn.
Does a wick through the swing count as a BOS?
Under the stricter convention, no. A wick through the level without a body close is read as a liquidity sweep. Some traders accept wicks on higher timeframes; whichever rule you use, apply it consistently. Trading involves risk, and no structure signal removes it.