ICT Displacement: What It Is and How to Spot It on the Chart
ICT displacement explained: how to recognise a real displacement move, a six-point checklist, and how it ties FVGs, MSS and order blocks together.
Displacement in ICT trading is a fast, decisive price move made of large-bodied candles with little overlap, strong enough to break a swing and usually to leave a fair value gap behind. It is the footprint of aggressive orders: one side of the market is executing in size and the other side is not resisting. This guide from LSG Club, the free trade journal for ICT traders, explains how to recognise displacement on a chart, how to tell it apart from an ordinary move, and how it ties together fair value gaps, market structure shifts and order blocks.
The short version: displacement is not a setup and not an entry. It is the quality test that most ICT concepts depend on. A fair value gap without displacement is just a gap, an order block without displacement is just a candle, and a break of structure without displacement is often only a stop run. Learn to see it first, and the rest of the ICT toolkit becomes much easier to read.
What is displacement in ICT?
Michael J. Huddleston (Inner Circle Trader) uses displacement to describe price moving away from a level with energy and intent. On the chart it looks like one or several candles whose bodies are clearly larger than the candles before them, closing near their extremes, with each candle opening roughly where the previous one closed. There is little back-and-forth inside the move. Price is not drifting; it is being repriced quickly.
ICT’s reading is that such moves happen when large participants need to fill orders and accept worse prices to do it. Whether or not you accept that story, the practical point is simple: a market that moves with displacement is showing you which side is in control right now, while a market that grinds slowly through a level is showing you very little.
Bullish and bearish displacement
- Bullish displacement — one or more large up-candles that close near their highs, break a recent swing high and usually leave a bullish fair value gap below the current price.
- Bearish displacement — one or more large down-candles that close near their lows, break a recent swing low and usually leave a bearish fair value gap above the current price.
Displacement is relative, not absolute
There is no fixed pip size for displacement. A 15-pip M5 candle on EURUSD during the London open can be displacement; the same 15 pips on a daily chart is noise. Always judge the move against the candles around it on the same timeframe and in the same session. What matters is that the move clearly stands out from the recent rhythm of price.
How to recognise displacement on a chart
Traders who struggle with displacement usually try to judge it by eye after the fact. A short checklist makes the call more consistent. The more of these features a move has, the more weight you can give it.
- Body size — the candle bodies are clearly larger than the recent average on that timeframe. Many traders use a simple rule of thumb such as a body at least one and a half to two times the average range of the last 10–20 candles, or a comparison with ATR.
- Close near the extreme — the candles close in the top or bottom quarter of their range, with small wicks in the direction of the move. A large candle with a long wick back against it shows rejection, not displacement.
- Little overlap — consecutive candles in the move barely overlap. Each one opens near the previous close and pushes on.
- A fair value gap — the move leaves at least one three-candle imbalance where the wicks of candle 1 and candle 3 do not overlap.
- A structural break — the move closes beyond a meaningful swing high or low, not just inside the existing range.
- Location and time — the move starts from a level that matters (a swept high or low, a higher-timeframe array) and happens in an active session rather than in the quiet hours.
Points 1–3 describe the candles themselves. Points 4–6 describe what the move achieved and where. A move that ticks the first three but breaks nothing is energetic but not necessarily useful. A move that breaks structure slowly, without the first three, is the case ICT traders treat with the most suspicion.
Displacement and fair value gaps
The fair value gap is the most visible trace displacement leaves. When the middle candle of three is large enough, the wicks of the first and third candle do not meet, and the range between them was traded in one direction only. The fair value gap trading strategy guide covers how to mark the gap and its 50% line, consequent encroachment.
The relationship works in both directions. Displacement usually creates a gap, and the presence of a clean gap is one of the easiest ways to confirm that a move really was displacement. A move that breaks a swing but leaves every candle overlapping its neighbours has no gap, and many ICT traders simply do not trade it: there is no obvious place for the retracement entry, and the move may not carry real intent.
Displacement also decides what happens to an existing gap. When price closes through an opposing fair value gap with displacement, that gap has failed and many traders start treating it from the other side, as an inverse FVG. A slow drift through the same gap does not carry the same message.
Displacement, BOS and the market structure shift
A break of structure is a close beyond the latest swing in the direction of the trend; if you need the basics first, start with what a break of structure (BOS) is and which swings count. Displacement is what separates a convincing break from a marginal one. A candle that closes one pip beyond the swing high after a slow climb has technically broken structure, but it has not shown much.
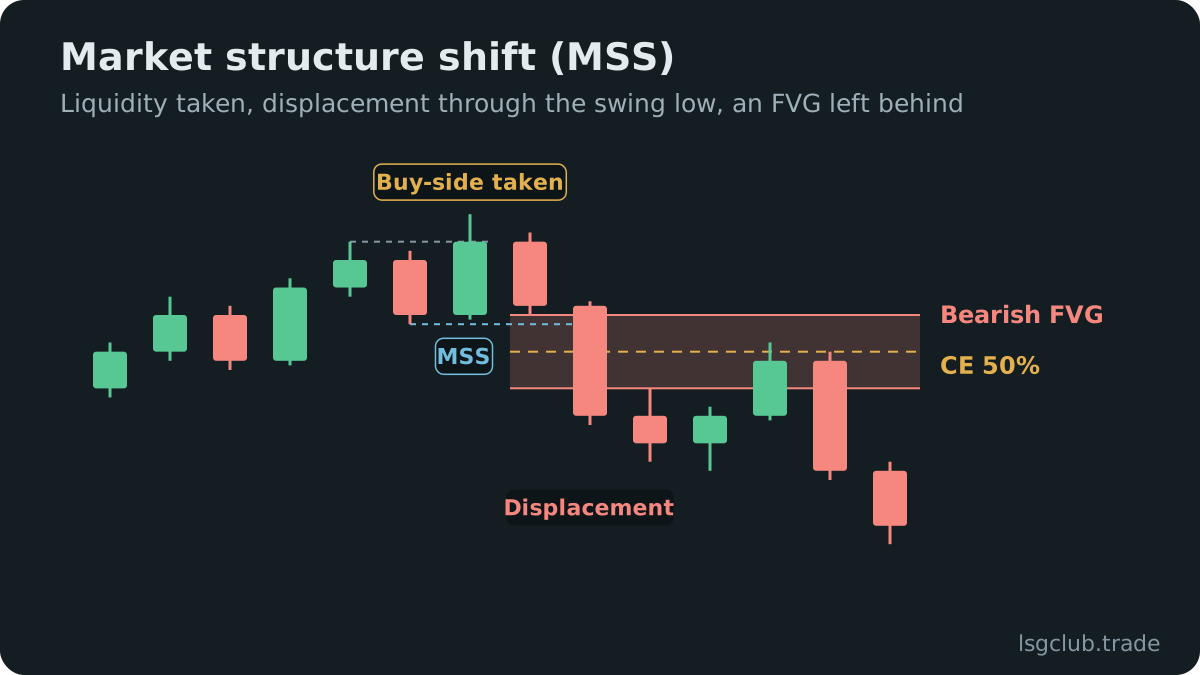
The ICT market structure shift makes displacement part of the definition. An MSS is a displacement break of the short-term swing that launched the most recent move, printed right after price has swept liquidity on the other side. Remove the displacement and what remains is closer to a generic change of character. The CHoCH vs BOS comparison shows how the three structure terms differ.
Displacement after a liquidity sweep
The sequence ICT traders look for most often is a sweep followed by displacement in the opposite direction. Price runs the stops above an obvious high, fails to hold, and then moves down hard through the last short-term low. The sweep shows where liquidity was taken; the displacement shows that the other side has taken control. The liquidity sweep explainer covers the first half of that sequence in detail.
Displacement and order blocks
In ICT’s strict definition, an order block is the last opposing candle before a displacement that breaks structure: the last down-close candle before a bullish displacement, or the last up-close candle before a bearish one. Without the displacement there is no order block, only a candle. The order block trading guide covers how to mark the block and its mean threshold.
This is the main reason beginners mark too many order blocks. Every swing has a last opposite candle, but only some swings end in a move that clearly outpaces the market. Asking “was the move away from this candle displacement?” removes most of the weak zones from the chart before you trade them.
The same logic applies when an order block fails. A breaker block forms when price closes through an order block with displacement after sweeping liquidity. A gentle push through the block is not enough to call it a breaker.
Real displacement vs a fake move
Not every large candle is displacement worth acting on. These are the situations where a big move tells you less than it seems to.
- News spikes — a high-impact release can print one huge candle in both directions within minutes. The size is real, but it reflects the release, not a steady shift in order flow. Many traders ignore the first candles after the release and wait for the dust to settle.
- Large wicks, small bodies — a candle with a long range but a close back in the middle is rejection, not displacement. Judge the body and the close, not the high-to-low range.
- Moves inside a range — a strong candle from the middle of a range to the middle of the range breaks nothing and leaves both sides of the range intact.
- Low-liquidity hours — during the quiet part of the Asian session or before a holiday, a modest order can move price more than usual. The candles look large only because everything around them is small.
- Late in the move — a large candle after price has already travelled a long way can be the final push into a target, not the start of a new leg.
Displacement vs expansion
Some traders use displacement and expansion as synonyms. A useful distinction: displacement is the first decisive move away from a level, the one that breaks structure and reveals intent; expansion is the larger leg that follows toward the next target. Displacement is what you read to decide whether to trade; expansion is what you hope to be positioned for. In the Power of 3 model, the displacement after the manipulation is the start of the distribution phase.
Which timeframe and session to read it on
Displacement exists on every timeframe, and the timeframe changes what it means. A daily displacement candle can define the draw on liquidity for weeks; an M5 displacement is an execution signal that may last an hour. A common approach is to set bias on the higher timeframes, then look for displacement on M5 or M15 to confirm that price is actually moving in the expected direction.
Timing matters as much as size. ICT traders look for displacement inside the Kill Zones, when the London and New York sessions bring volume. The forex Kill Zone guide lists the windows in New York time. A displaced move at 02:30 New York time during London carries more information than the same candle at 20:00, when only a thin market is trading.
Worked example: bullish displacement on EURUSD
The prices below are illustrative, chosen to show the logic rather than a real trade. Imagine EURUSD on the M5 chart during the London Kill Zone, with a bullish bias from the higher timeframes.
The sweep and the move
Price trades between 1.0835 and 1.0850 through the Asian session. In London it drops to 1.0828, taking the stops below the Asian low at 1.0835. The recent M5 candles have bodies of about 3–4 pips. Then three up-candles print in a row with bodies of roughly 9, 11 and 8 pips, each closing near its high and opening near the previous close. Price closes at 1.0856, above the last short-term swing high at 1.0848.
Reading it
- Body size — roughly two to three times the recent average: yes.
- Closes near the highs, little overlap: yes.
- Fair value gap — the first candle’s high at 1.0838 and the third candle’s low at 1.0845 leave a gap of 1.0838–1.0845: yes.
- Structural break — the close at 1.0856 is above the 1.0848 swing high: yes.
- Location and time — after a sweep of the Asian low, inside the London Kill Zone: yes.
This move qualifies as displacement on every point. What a trader does with it depends on their own plan: some wait for price to retrace into the 1.0838–1.0845 gap, some use the order block at the base of the move, some do nothing because the bias or the news calendar says otherwise. Displacement only tells you that the read has been confirmed; it does not guarantee that price will continue. In the losing case, price retraces through the gap and back below 1.0828, which shows the move was not the start of a new leg after all.
Common displacement mistakes
- Labelling any big candle as displacement — without a structural break and a sensible location, it is just volatility.
- Judging it after the fact — a move that later ran 100 pips looks like perfect displacement in hindsight. Decide with the checklist while the candles are printing.
- Mixing timeframes — calling an M1 burst displacement while the M15 chart shows a tidy pullback inside a range.
- Ignoring news — reading a release spike as a change in order flow, then entering into the reversal of the spike.
- Chasing the move — entering on the displacement candle itself at the worst price, with a stop that is far wider than the plan allowed, instead of waiting for a retracement or skipping the trade.
Displacement checklist
- The bias is written down before the session, and the move goes in that direction.
- The candle bodies are clearly larger than the recent average on the same timeframe.
- The candles close near their extremes with little overlap.
- The move leaves at least one clean fair value gap.
- The move closes beyond a meaningful swing, not just inside the range.
- It starts from a level that matters, ideally after a liquidity sweep.
- It happens in an active session and not in the minutes around a high-impact release.
If most of the lines are missing, treat the move as noise. Trading involves risk, and even clean displacement is followed by losing trades; practise the read on a demo account and keep the risk per trade small and fixed in advance.
How to track displacement in a journal
Displacement is a judgement call, which makes it a perfect thing to measure. For every trade that relied on it, note the timeframe, the session, whether a sweep came first, whether a gap was left and whether the move broke structure. After a few dozen trades you can compare the results in R and see whether your strict, checklist-perfect displacement trades really outperform the borderline ones. An ICT trading journal that keeps each trade on a real chart makes that review much faster. Opening gaps are another set of reference levels traders combine with displacement; the NWOG and NDOG guide explains them. For the full vocabulary, see the ICT concepts reference.
FAQ
What does displacement mean in ICT trading?
Displacement is ICT’s term for a fast, one-directional move made of large-bodied candles with little overlap. It shows that one side of the market is executing aggressively. A true displacement usually breaks a swing high or low and leaves a fair value gap behind.
How big does a candle need to be to count as displacement?
There is no fixed size. Displacement is relative to the candles around it on the same timeframe. A practical rule of thumb is a body at least one and a half to two times the recent average range or ATR, with a close near the extreme, but the structural break and the gap matter as much as the size.
Does displacement always create a fair value gap?
Usually, but not always. A single very large candle or a series of large candles almost always leaves a three-candle gap, and many traders use the gap as confirmation. A move with no gap at all is often treated as weaker displacement or not as displacement.
What is the difference between displacement and a market structure shift?
Displacement describes how price moves; a market structure shift describes what the move did. An MSS is a displacement break of a short-term swing right after a liquidity sweep. Displacement can also occur in the trend direction, as a strong break of structure, without being a shift.
Can I enter a trade on the displacement candle?
Some traders do, but most ICT traders wait for price to retrace into the gap or the order block that the displacement created. Entering on the displacement candle means buying or selling after the move has already run, usually with a wider stop. Whatever you choose, define it in your plan before the session.